ABBV - AbbVie Corp. Revenue Growth Rate YoY (Last Twelve Months)

Successful marketing and patent protection at AbbVie Inc. (ABBV) support an upward trend, where the chart of annual sales growth for TTM confirms business resilience, and the 10.50 level records fresh values. A neutral geopolitical backdrop ensures stability, although risks of raw material supply chain disruptions persist. Legal barriers in foreign jurisdictions determine the holding's future strategic benchmarks.

AbbVie - analytical breakdowns and key metrics (ABBV)
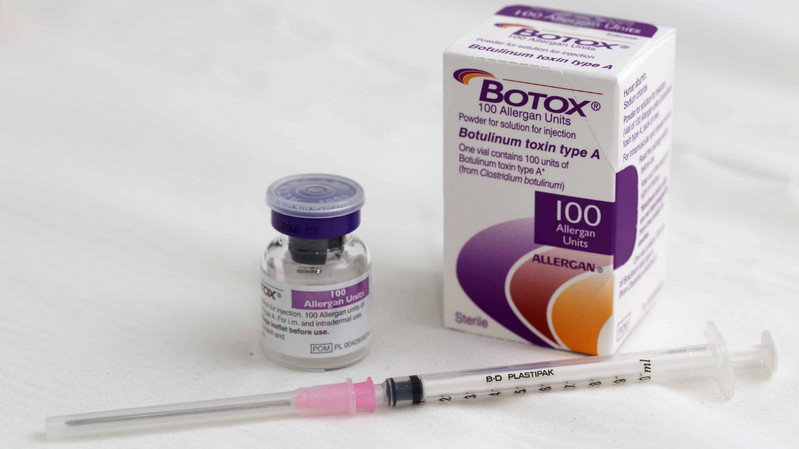
AbbVie Inc. (ABBV) ensures seamless drug distribution through flawless global logistics and site diversification, which directly impacts the trailing twelve-month (TTM) sales growth rate. This metric measures daily revenue dynamics over the past twelve months relative to the previous year, allowing investors to assess the fundamental stability of market share and the risk of overpaying for the asset in the absence of synchronous profit growth.
