Revenue Dynamics YoY (Last Twelve Months): Aurora Cannabis (ACB)
With a robust patient base and licenses, Aurora Cannabis (ACB) maintains its current position, although global logistical disruptions and patent disputes create long-term risks. The YoY sales growth percentage for TTM on the GURU.Markets chart demonstrates this balance, where -21.70 reflects the latest value of the metric. Meanwhile, oversupply in Canada has neutralized pricing power, forcing the company to cut costs.

Aurora Cannabis, Inc. (ACB) - metric breakdowns and financial figures
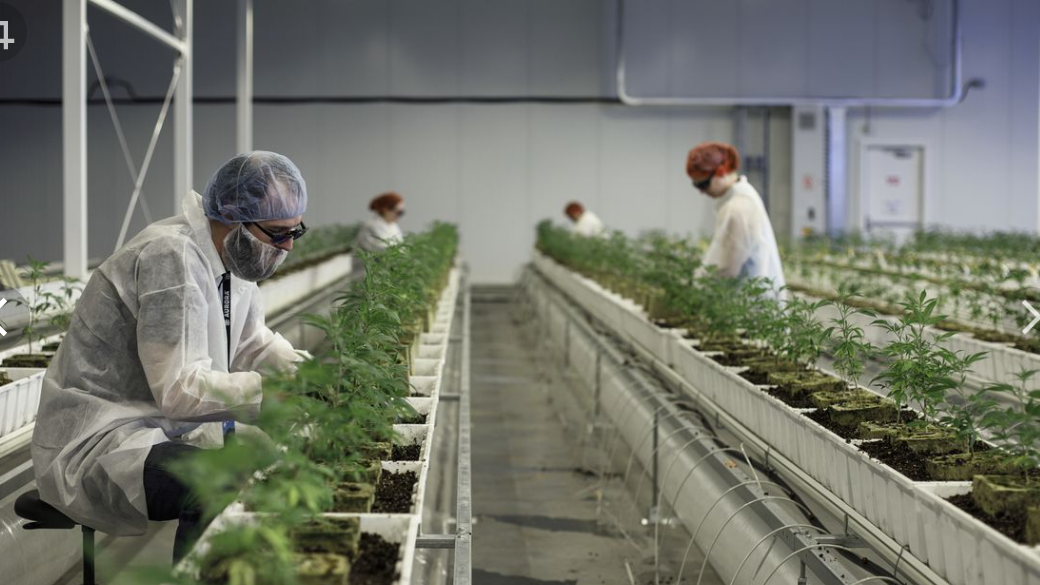
Analyzing revenue volatility via the trailing twelve months (TTM) growth of operating sales revenue helps identify asset overvaluation risks during periods of market optimism. For Aurora Cannabis (ACB), whose scalability is constrained by greenhouse expenditures and energy costs, this indicator measures the daily rate of change in rolling annual revenue, reflecting how growth rates depend on fluctuations in wholesale product prices.
