Sales Growth YoY (Last 12 Months): Akanda Inc (AKAN)

The year-over-year percentage change in LTM sales volume on the GURU.Markets chart illustrates delivery dynamics to pharmacies in Britain and Germany, where the 84.00 indicator expresses the state of the metric. Akanda maintains a stable cash flow based on European cannabis cultivation; however, licensing advantages in Africa are offset by oversupply and the slow pace of legalization in the US.

Summary analytical data breakdowns for akandacorp.com (AKAN)
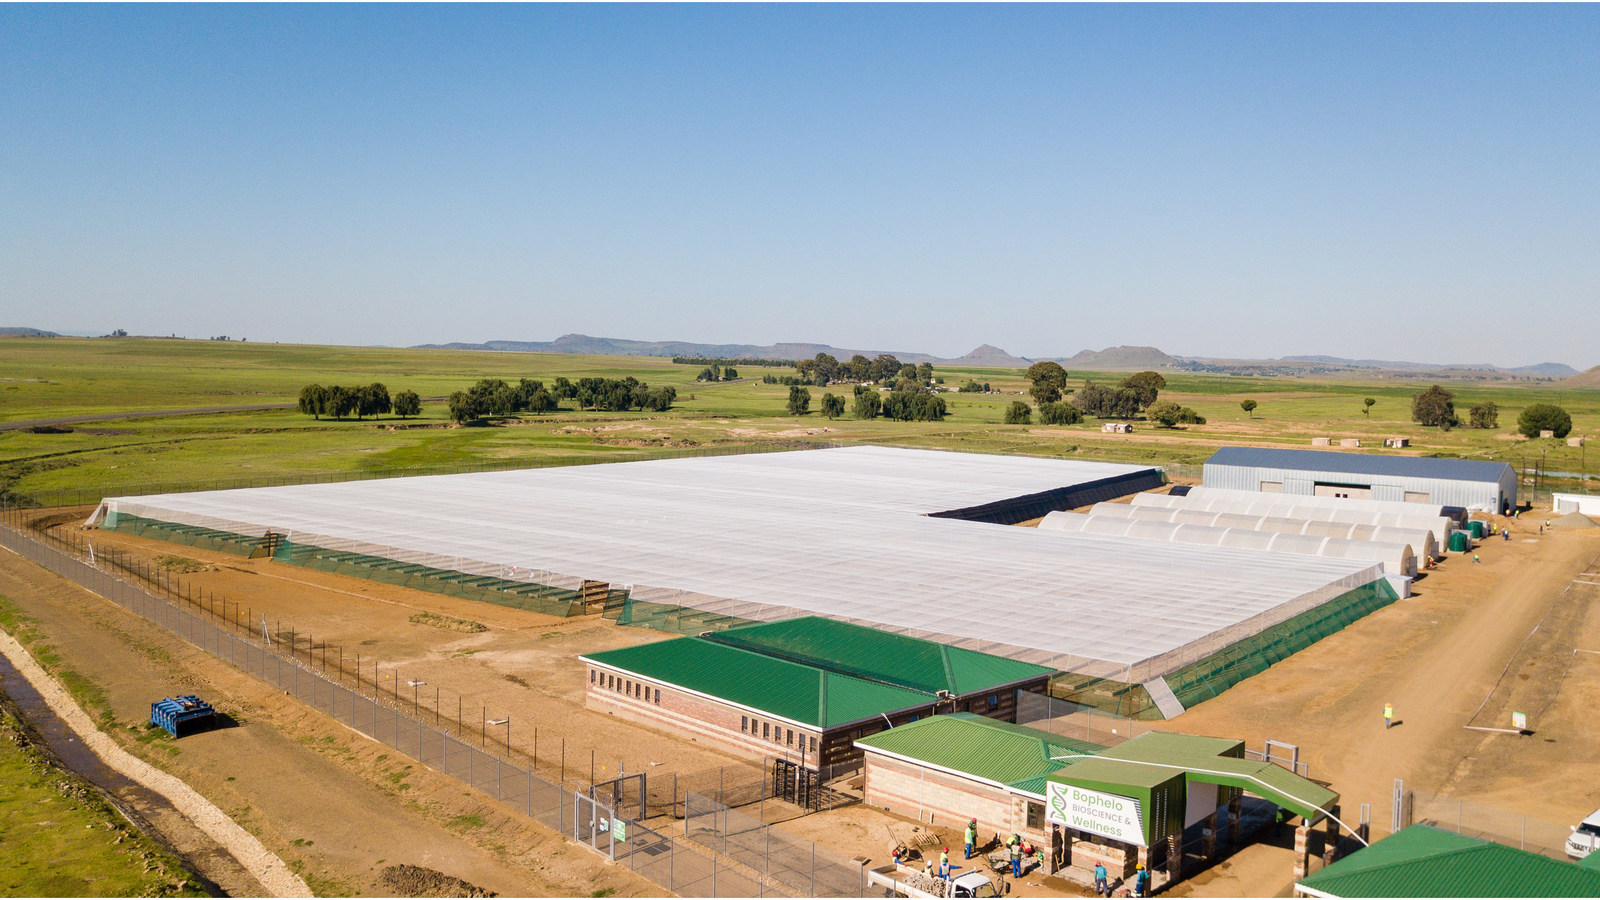
This indicator measures business expansion rates by comparing the current rolling annual revenue with the same interval from the previous period to identify real revenue dynamics. By analyzing the 12-month YoY revenue growth chart, an investor can assess the effectiveness of Akanda (AKAN) expansion in the European market via low-cost exports from Africa, which confirms the sustainability of its competitive advantage.
