AIP - Arteris IP Market Capitalization-to-Revenue Ratio

Symbol and logo of brand Arteris IP (AIP)

The P/S multiple trend demonstrates the scalability of Arteris, Inc., which generates revenue from chip architecture without incurring fab costs. The absence of physical shipments eliminates logistical risks, passing them onto partners. Diversification through AI solutions and the automotive industry protects royalties from sector downturns. Meanwhile, the 10.80 mark serves as a current indicator, helping to assess the business value relative to its revenue.

AIP arteris.com Price-to-Revenue Ratio (07/04/2022 - 11/13/2026)
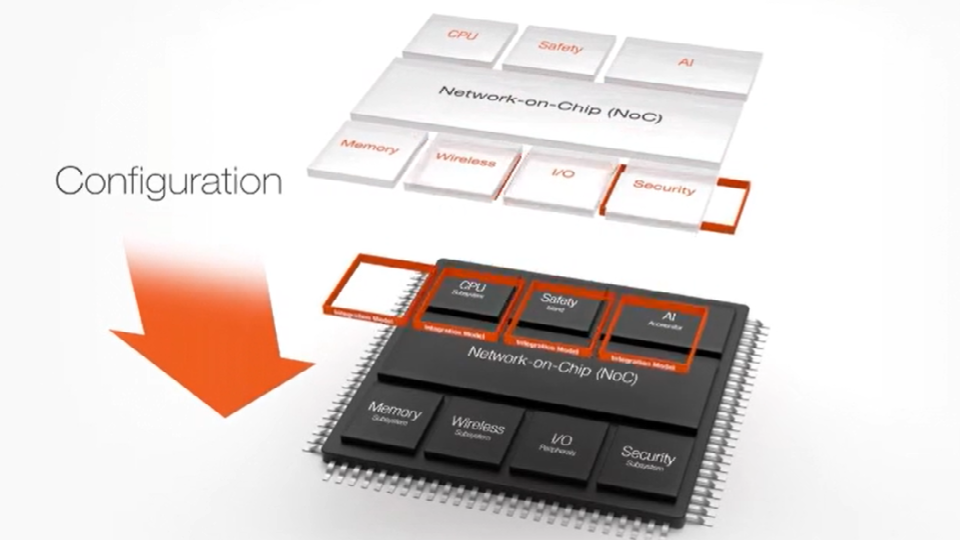
Mass-produced product of Arteris, Inc.

To assess investment attractiveness, the ratio of market capitalization to annual revenue is used, which allows for the determination of the premium paid for the asset. By analyzing the price-to-sales multiple, an investor can gauge the monetization efficiency of the intellectual property of Arteris, Inc. (AIP), where the value of licenses for NoC technologies for AI processors directly determines the company's fundamental value.

Competitors of Arteris, Inc.

AVGO (broadcom.com) - Market Capitalization-to-Revenue Ratio|Advanced Micro Devices, Inc. - Market Cap to Revenue|Market Capitalization-to-Revenue Ratio TXN|ARM Limited - P/S Multiple|Price to Sales Analog Devices|Intel Corporation (INTC) - Price-to-Revenue Ratio|MRVL (marvell.com) - Price-to-Revenue Ratio|NXPI (NXP) - P/S Multiple|Price to Sales Astera Labs Inc ALAB|P/S Multiple MCHP|Market Cap to Revenue Credo Semiconductor CRDO|STMicroelectronics N.V. - Market Cap to Revenue|Market Cap to Sales Volume ON (onsemi.com)|SWKS - Price-to-Revenue Ratio|Market Capitalization-to-Revenue Ratio RMBS (Rambus Inc)|MACOM Tech (MTSI) - Price-to-Revenue Ratio|Price to Sales Lattice Corp (LSCC)|Price-to-Revenue Ratio SiTime Corporation|Market Cap to Revenue Ratio LFUS (littelfuse.com)|P/S Multiple CRUS|Price-to-Revenue Coefficient Impinj Inc|P/S Multiple SMTC (Semtech Corp.)|SLAB - Market Cap to Revenue|AMBA - Price-to-Revenue Ratio|Price-to-Revenue Coefficient Silicon Motion Corp. SIMO|SYNA: P/S Multiple|Diodes Inc (DIOD) - P/S Multiple|Price-to-Revenue Ratio Power Integrations Corp|VICR: Market Capitalization-to-Revenue Ratio|Market Cap to Revenue VSH (Vishay Intertechnology)|Market Cap to Sales Volume HIMX|P/S Multiple NVTS (Navitas Semiconductor Corporation)|Alpha and Omega Semiconductor (AOSL) - Price to Sales|AMBQ - Price-to-Revenue Ratio|Market Capitalization-to-Revenue Ratio CEVA (CEVA, Inc.)|WOLF: P/S Multiple|VLN - Price-to-Revenue Coefficient|Price-to-Revenue Ratio AXT|Everspin Technologies, Inc. (MRAM) - Price-to-Revenue Coefficient|Market Cap to Revenue NA (Nano Labs Corporation)|ATOM (Atomera Corp) - Market Capitalization-to-Revenue Ratio|P/S Multiple GSIT (GSI Technology, Inc.)|Price-to-Revenue Coefficient GCT Semiconductor Holding, Inc. (GCTS)|MOBX - Price-to-Revenue Ratio|PXLW (Pixelworks, Inc.) - Market Cap to Revenue Ratio|AKTS: P/S Multiple|Market Cap to Revenue Penguin Solutions|Market Cap to Revenue TGAN