TXN - Texas Instruments Incorporated Market Capitalization-to-Revenue Ratio

Symbol and logo of brand Texas Instruments Incorporated (TXN)

Texas Instruments (TXN) is betting on expanding its plant capacities and chip modernization plans. The market cap-to-revenue dynamics on GURU.Markets highlight the current trend, where 13.70 records the value of this parameter. Business stability relies on mass demand for affordable analog chips. A leading sector position and deep integration into the automotive industry create a powerful defensive barrier.

TXN ti.com Price-to-Revenue Ratio (07/04/2022 - 11/13/2026)

Analytical breakdowns for Texas Instruments Inc. (TXN)
- share price and consensus valuation forecast:
Summary company analytics:ti.com
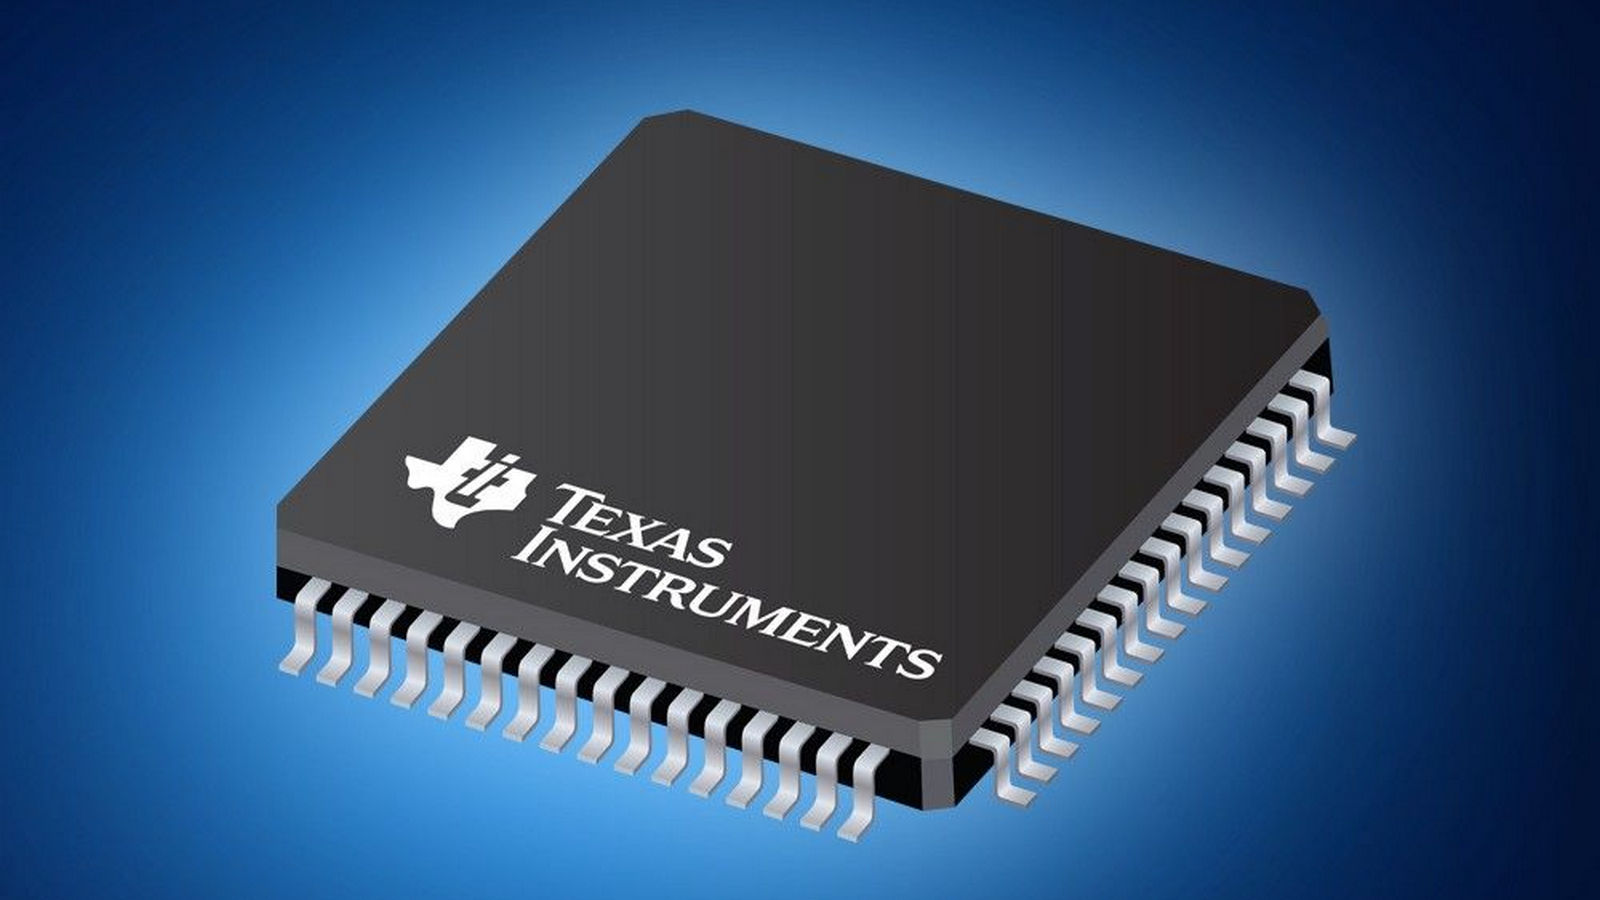
Mass-produced product of Texas Instruments

By leveraging its own fabrication plants and an extensive chip catalog, Texas Instruments maintains low production costs, making the company's revenue the foundation of its valuation. The P/S multiple measures market capitalization relative to sales volume, allowing for an assessment of the asset's potential overheating. By analyzing the industry-average P/S for Texas Instruments on the GURU.Markets platform, an investor can determine an entry point and avoid purchasing overvalued securities at their price peak.

Competitors of Texas Instruments

AVGO (broadcom.com) - Market Capitalization-to-Revenue Ratio|Advanced Micro Devices, Inc. - Market Cap to Revenue|Market Capitalization-to-Revenue Ratio ARM|Analog Devices Corp - P/S Multiple|Price to Sales Intel Electronics|Marvell Technology (MRVL) - Price-to-Revenue Ratio|NXPI (nxp.com) - Price-to-Revenue Ratio|ALAB (Astera Labs) - P/S Multiple|Price to Sales Microchip Technology Incorporated MCHP|P/S Multiple CRDO|Market Cap to Revenue STMicroelectronics Group STM|ON Semiconductor - Market Cap to Revenue|Market Cap to Sales Volume SWKS (skyworksinc.com)|RMBS - Price-to-Revenue Ratio|Market Capitalization-to-Revenue Ratio MTSI (MACOM Technology Solutions Holdings, Inc.)|Lattice Semiconductor Corp (LSCC) - Price-to-Revenue Ratio|Price to Sales SiTime Timing (SITM)|Price-to-Revenue Ratio Littelfuse, Inc.|Market Cap to Revenue Ratio CRUS (cirrus.com)|P/S Multiple PI|Price-to-Revenue Coefficient Semtech Corp|P/S Multiple SLAB (Silicon Labs Inc)|AMBA - Market Cap to Revenue|SIMO - Price-to-Revenue Ratio|Price-to-Revenue Coefficient synaptics.com SYNA|DIOD (Diodes Inc.) - Market Cap to Revenue|POWI: Market Cap to Sales Volume|VICR (Vicor Corp.) - P/S Multiple|Price to Sales Vishay Corp VSH|Market Cap to Revenue HIMX (Himax Technologies Inc)|navitassemi.com - Market Cap to Revenue Ratio|P/S Multiple AOSL (Alpha & Omega Semiconductor)|P/S Multiple Ambiq Micro, Inc. AMBQ|CEVA - Price-to-Revenue Ratio|Price-to-Revenue Coefficient Wolfspeed Corp WOLF|AIP (Arteris, Inc.) - Market Cap to Revenue|valens.com - Market Capitalization-to-Revenue Ratio|AXTI (AXT) - P/S Multiple|Everspin Technologies, Inc. (MRAM) - Price-to-Revenue Coefficient|Price-to-Revenue Ratio Nano Labs Corporation (NA)|Atomera Corp - Market Cap to Revenue Ratio|Price-to-Revenue Ratio GSI Technology, Inc. GSIT|Price-to-Revenue Coefficient GCT Semiconductor Holding, Inc. (GCTS)|MOBX: Market Cap to Revenue|Pixelworks, Inc. - Market Cap to Sales Volume|akoustis.com (AKTS) - Price-to-Revenue Ratio|Penguin Solutions - Market Capitalization-to-Revenue Ratio|Market Cap to Revenue TGAN