Akanda (AKAN) - Cash per Share

Highly liquid assets per share in the GURU.Markets chart data demonstrate capital dynamics where the 0.29 indicator confirms the current level for Akanda (AKAN). The business remains vulnerable due to its narrow specialization in medical cannabis and price volatility. Growth is driven by exports from Africa and German law, while the operating model relies on third-party logistics providers and laboratories.

Analytical breakdowns for Akanda
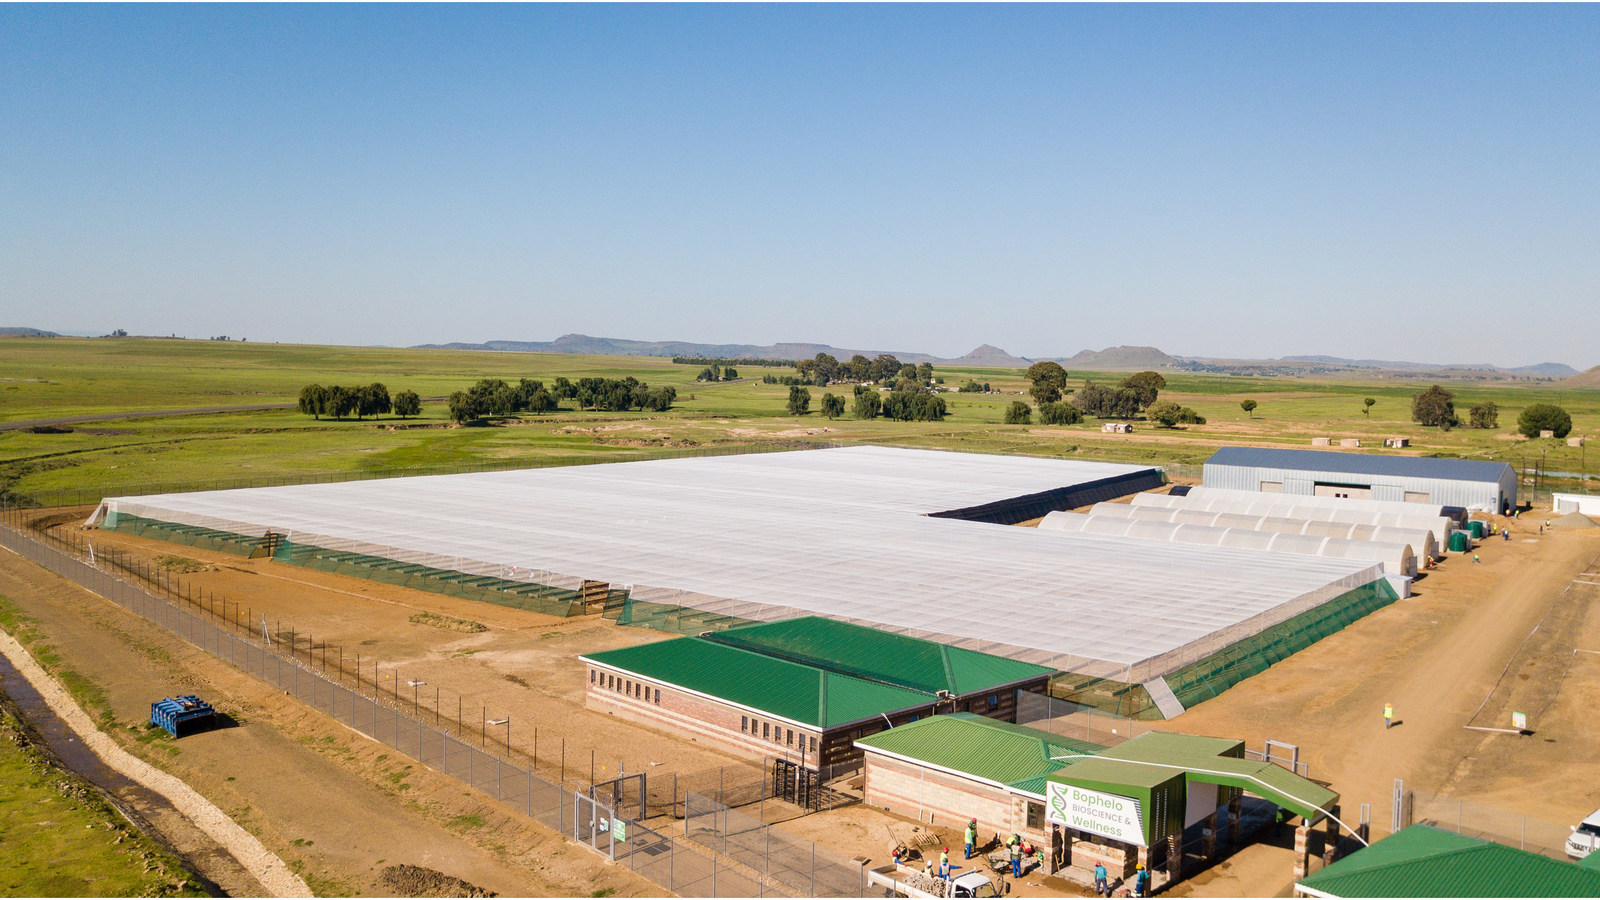
Complex logistics and regulatory barriers in the medical cannabis sector require Akanda (AKAN) to maintain a high liquidity reserve. This cash per share calculation visualizes the available volume of net assets on a per-share basis. This metric allows for a real-time assessment of how new issuances or write-offs impact financial stability. While a high figure protects the business from operational risks, it may also indicate investment inefficiency. This serves as a key indicator for evaluating speculative assets.
