AXP: American Express Company Market Cap to Revenue

Brandmark of American Express Company (AXP)

American Express (AXP) attracts top management and IT specialists, maintaining its status as a prestigious employer. The historical P/S ratio helps track this trend, and the metric has currently reached the level of 2.50. The business generates revenue from high commissions due to low demand elasticity. The uniqueness of the model is based on combining issuer and acquirer functions within a closed network for high-net-worth clients.

Price-to-Revenue Ratio: American Express Company (AXP) for 07/04/2022 - 11/13/2026

Analytical breakdowns for American Express Co. (AXP)
Summary company analytics:americanexpress.com (AXP)
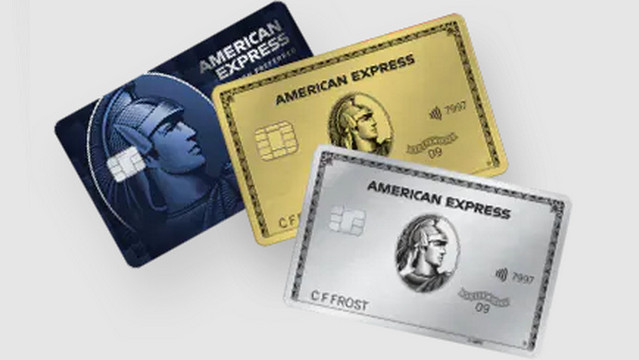
Finished products of Amex

The closed payment ecosystem of American Express (AXP) with its premium client segment ensures high business resilience, making the company a reliable asset for long-term capital. By analyzing the price-to-sales ratio dynamics, an investor assesses the market value of each unit of sales, where a declining multiple signals that the business is undervalued relative to its ability to generate revenue from acquiring and issuance.

Competitors of American Express

Price-to-Revenue Coefficient visa.com|P/S Multiple MA (Mastercard)|FI - Market Cap to Revenue|PayPal Inc. - P/S Multiple|XYZ - P/S Multiple|Fidelity (FIS) - Price-to-Revenue Ratio|Market Cap to Revenue Ratio AFRM|Market Cap to Revenue CPAY|GPN: Market Capitalization-to-Revenue Ratio|P/S Multiple FOUR|WEX - Price to Sales|StoneCo Ltd. - Market Cap to Revenue|ACIW: Market Cap to Revenue Ratio|PAY - Price-to-Revenue Ratio|Price-to-Sales Ratio DLO|Euronet Worldwide Inc (EEFT) - Price-to-Revenue Ratio|Remitly Corp - Market Capitalization-to-Revenue Ratio|PAGS (PagSeguro Digital Ltd.) - P/S Multiple|Price to Sales ncratleos.com NATL|Price-to-Revenue Ratio westernunion.com (WU)|Price-to-Revenue Coefficient Marqeta Inc|Price-to-Revenue Ratio Payoneer Corp PAYO|Price-to-Revenue Coefficient Evertec Group (EVTC)|CompoSecure, Inc. - P/S Multiple|NYAX - P/S Multiple|IDT (idt.net) - Market Cap to Revenue|Market Cap to Revenue Ratio FLYW|Price-to-Revenue Ratio i3 Verticals Corp|Paysafe Corp - Price-to-Sales Ratio|Price-to-Revenue Ratio Cantaloupe, Inc. (CTLP)|PRTH: Price-to-Sales Ratio|P/S Multiple CASS (Cass Information Systems, Inc.)|P/S Multiple Repay Holdings RPAY|IMXI: Market Cap to Revenue|Price to Sales Lesaka Corp|Paysign, Inc. (PAYS) - Price-to-Revenue Ratio|Market Cap to Revenue CoreCard|PMTS (CPI Card Group) - P/S Multiple|Price to Sales TROOPS Corp TROO|Price-to-Revenue Ratio CURRENC Group Inc. (CURR)|xbpeurope.com - Market Cap to Revenue Ratio|PublicSquare - Market Cap to Revenue|Market Cap to Sales Volume FNGR (FingerMotion Inc)|SURG - Price-to-Revenue Ratio|Price-to-Revenue Coefficient Usio, Inc. USIO|NUKK: P/S Multiple|The OLB Group (OLB) - P/S Multiple|Price-to-Revenue Ratio Future FinTech Group Inc.|Market Cap to Revenue DigiAsia Corporation (FAAS)|P/S Multiple APCX|BMTX - Price to Sales|Price-to-Revenue Ratio Global Blue GB|Market Capitalization-to-Revenue Ratio NVEI|Block, Inc. - P/S Multiple