Boise Cascade Co. (BCC) - Market Cap to Net Income Ratio

Boise Cascade Building Products - graphic logo of issuer BCC

The synergy of in-house production and powerful distribution, coupled with low pricing power, makes Boise Cascade Company (BCC) dependent on raw material volatility, as confirmed by the company's quarterly P/E. The current 19.40 metric determines this valuation level. The final picture is further complemented by the sensitivity of earnings to mortgage rates and US housing completion rates, which influence the asset's market value.

Boise Cascade Co. (BCC) - Price to Earnings Ratio from 07/04/2022 to 11/14/2026

Analytical breakdowns for Boise Cascade Company
- current price and projected stock value:
Summary company analysis:bc.com BCC
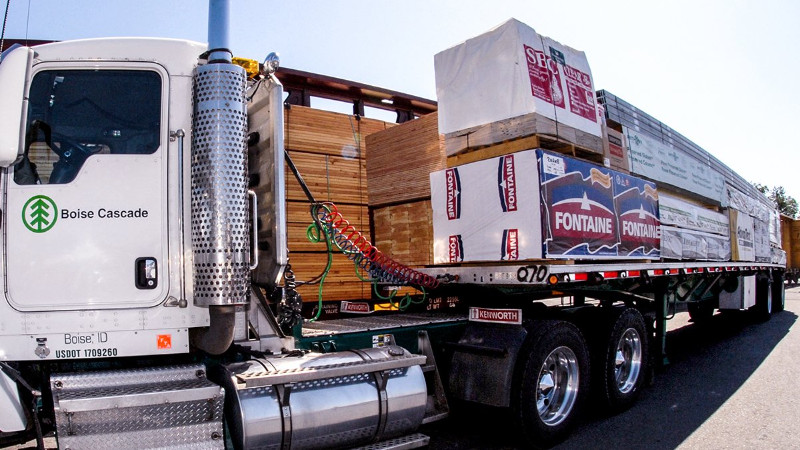
Flagship merchandise of Boise Cascade

The P/E ratio determines the market value of one dollar of net income, allowing an investor to assess the degree of overpayment for an asset through the ratio of share price to earnings. By analyzing the P/E time series of Boise Cascade Company (BCC), one can identify valuation anomalies which, in the case of Boise Cascade Company (BCC), reflect the cyclical dependence of earnings on the scale of construction projects and the efficiency of production capacity utilization.

Competing companies

Price to Earnings Multiple SHW (Sherwin-Williams Co.)|P/E Multiple CRH|Fastenal Co. (FAST) - Market Cap to Net Income Ratio|Vulcan Materials Corp - Price to Earnings Ratio|Company Value to Net Income MLM|AMRZ - Price to Earnings Ratio|Market Cap to Net Income MAS|Builders FirstSource (BLDR) - Price to Earnings Ratio|Cemex - Company Value to Net Income|Price to Earnings Ratio QXO Corp|Market Cap to Earnings Owens Corning Inc. OC|P/E Multiple BLD|ir.jameshardie.com.au - Price to Earnings Multiple|Mueller Industries - Price to Earnings Ratio|P/E Multiple ADS WMS|Core & Main Corp - P/E Multiple|Armstrong Corp (AWI) - Price to Earnings Ratio|MHK (Mohawk Industries, Inc.) - Price to Earnings Ratio|SSD: Market Price to Net Income Ratio|Price to Earnings Ratio Eagle Materials|Valmont Industries (VMI) - Business Payback Period|P/E Multiple UFPI|Price to Earnings Ratio TREX (Trex Corp)|Price to Earnings Ratio Gypsum Management and Supply GMS|United States Lime & Minerals, Inc. (USLM) - Market Cap to Earnings|Patrick Industries, Inc. - P/E Multiple|Business Payback Period Tecnoglass Inc TGLS|Titan Cement America (TTAM) - Price to Earnings Ratio|ATKR - Business Payback Period|MBC (MasterBrand, Inc.) - P/E Multiple|Market Cap to Earnings gibraltar1.com ROCK|Price to Earnings Ratio JBI (janusintl.com)|APOG (Apogee Enterprises Inc) - Company Value to Net Income|P/E Multiple LOMA (Loma Negra Corp)|NX - Price to Earnings Ratio|Cementos Pacasmayo - P/E Multiple|ASPN - P/E Multiple|JELD-WEN Holding (JELD) - Price to Earnings Ratio|FSTR - Business Payback Period|SMID (Smith-Midland Corp) - P/E Multiple|Price to Earnings Ratio Alpha Pro Tech Corporation (APT)|P/E Multiple NWGL|P/E Multiple wf.international (WXM)|P/E Multiple AEHL (Antelope Enterprise Holdings Limited)|JCTC: Price to Earnings Multiple|Capstone - P/E Multiple|Market Cap to Earnings The AZEK Company|BECN (Beacon Roofing Supply) - Price to Earnings Ratio|The Dixie Group - Company Value to Net Income|SUM (Summit Materials) - P/E Multiple|Price to Earnings Ratio Encore Wire Corp (WIRE)