Simpson Manufacturing Corp (SSD) - Market Cap to Net Income Ratio

Simpson Manufacturing Co Inc - graphic logo of issuer SSD

Simpson Manufacturing revenues rely on residential sector demand and steel costs. High operational efficiency enables the scaling of sales through infrastructure projects. The integration of fastening systems into engineering projects creates significant switching costs for customers. The current P/E valuation clearly demonstrates the stock's payback period, with the metric settling at 21.80.

Simpson Manufacturing Corp (SSD) - Price to Earnings Ratio from 07/04/2022 to 11/10/2026

Analytical breakdowns for Simpson Manufacturing
- current price and projected stock value:
Summary company analysis:simpsonmfg.com SSD
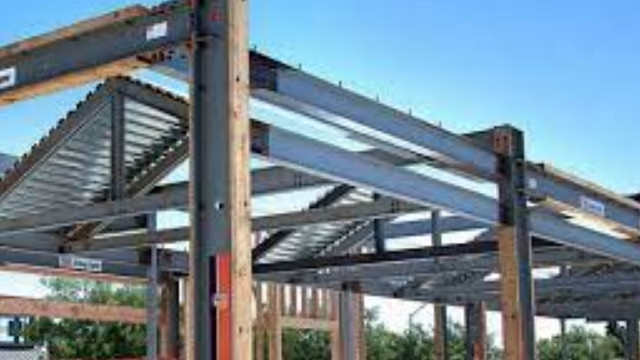
Flagship merchandise of Simpson Strong-Tie

For Simpson Manufacturing (SSD), dependence on imported metal costs and trade tariffs makes the company's P/E ratio based on net income a key indicator of the balance between market value and actual profitability. This ratio measures the cost of one dollar of profit, allowing investors to assess the risk of overpaying for the asset amid cost volatility, which ultimately determines the sustainability of dividend payments.

Competing companies

Price to Earnings Multiple SHW (Sherwin-Williams Co.)|P/E Multiple CRH|Fastenal Co. (FAST) - Market Cap to Net Income Ratio|Vulcan Materials Corp - Price to Earnings Ratio|Company Value to Net Income MLM|AMRZ - Price to Earnings Ratio|Market Cap to Net Income MAS|Builders FirstSource (BLDR) - Price to Earnings Ratio|Cemex - Company Value to Net Income|Price to Earnings Ratio QXO Corp|Market Cap to Earnings Owens Corning Inc. OC|P/E Multiple BLD|ir.jameshardie.com.au - Price to Earnings Multiple|Mueller Industries - Price to Earnings Ratio|P/E Multiple ADS WMS|Core & Main Corp - P/E Multiple|Armstrong Corp (AWI) - Price to Earnings Ratio|MHK (Mohawk Industries, Inc.) - Price to Earnings Ratio|EXP: Market Price to Net Income Ratio|Price to Earnings Ratio Valmont|Universal Forest Products (UFPI) - Business Payback Period|Price to Earnings Ratio Trex Company Inc (TREX)|Business Payback Period gms.com|P/E Multiple USLM (U.S. Lime & Minerals)|Business Payback Period patrickind.com (PATK)|TGLS - Price to Earnings Ratio|Boise Cascade Corp (BCC) - Price to Earnings Ratio|Titan Cement America (TTAM) - Price to Earnings Ratio|Market Cap to Net Income ATKR (Atkore Corp)|Price to Earnings Ratio MasterBrand, Inc.|gibraltar1.com (ROCK) - Business Payback Period|Price to Earnings Ratio janusintl.com (JBI)|APOG - Market Cap to Earnings|Price to Earnings Ratio Loma Negra Corp LOMA|NX: Price to Earnings Multiple|CPAC: Price to Earnings Ratio|Company Value to Net Income ASPN (aerogel.com)|JELD-WEN Holding (JELD) - Price to Earnings Ratio|Price to Earnings Ratio L.B. Foster Co.|SMID (Smith-Midland Corp) - P/E Multiple|P/E Multiple Alpha Pro Tech Corporation|Price to Earnings Ratio Nature Wood Group (NWGL)|wf.international - Price to Earnings Multiple|Antelope Enterprise Holdings Limited - Price to Earnings Ratio|P/E Multiple Jewett-Cameron JCTC|Capstone - P/E Multiple|Market Cap to Net Income AZEK|BECN: P/E Multiple|The Dixie Group (DXYN) - P/E Multiple|SUM (Summit Materials) - P/E Multiple|Price to Earnings Ratio Encore Wire Corp (WIRE)