BTM - Bitcoin Depot, Inc. Market Capitalization-to-Revenue Ratio

Corporate company logo of Bitcoin Depot Inc. (BTM)

The price/sales chart captures the structural growth of Bitcoin Depot Inc. (BTM), as the demand for digitalization offsets external risks. The business relies on an IT core to process transactions across its terminal network and is implementing energy-efficient solutions to reduce its carbon footprint. Price action relative to revenue remains volatile, with 0.00 serving as the final level marker.

BTM (Bitcoin Depot Inc.) P/S Multiple history from 02/21/2024 to 06/06/2026

Metric breakdowns and analytics for Bitcoin Depot Inc. (BTM)
- stock price and consensus target price:
- market capitalization statistics:
Summary company analytics:Bitcoin Depot, Inc.
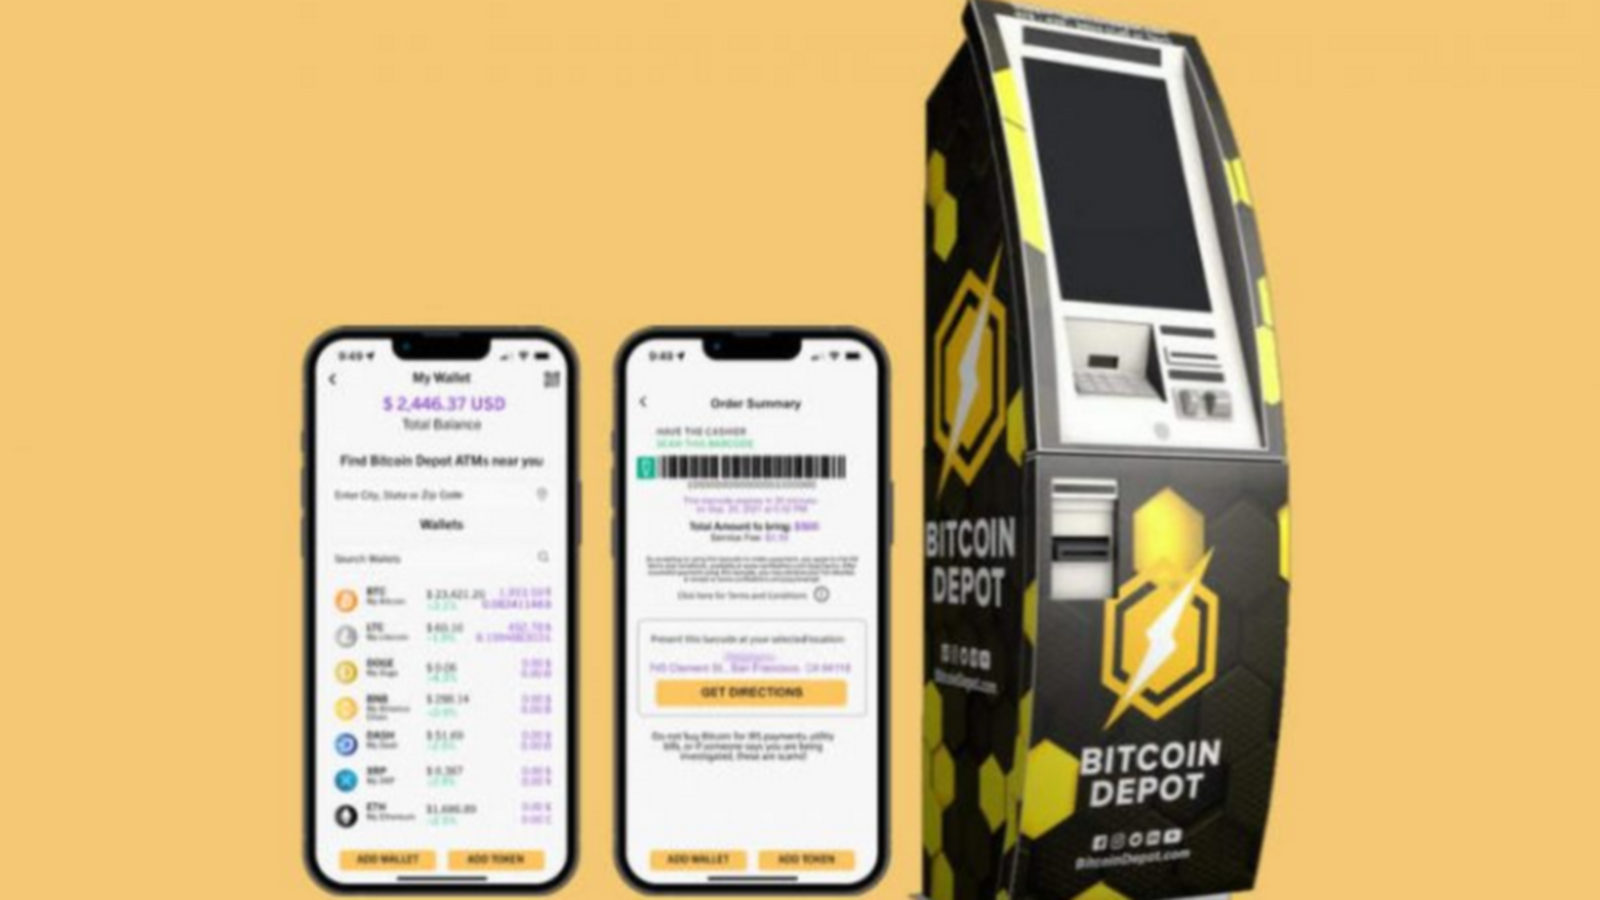
Flagship merchandise of Bitcoin Depot Corp

Revenue for Bitcoin Depot Inc. (BTM) is critically dependent on crypto cycles, making the P/S ratio an effective tool for valuing the business relative to actual cash flows during periods of volatility. This ratio measures the market price of one dollar of sales, helping investors determine whether the asset is overvalued or undervalued by analyzing the relationship between market capitalization and revenue on this chart.

Who Bitcoin Depot Inc. competes with

coinbase.com - Market Cap to Revenue Ratio|Circle - Market Cap to Revenue|Market Capitalization-to-Revenue Ratio IREN|BitMine Tech - P/S Multiple|BLSH (Bullish Corp) - Market Cap to Revenue Ratio|FIGR: P/S Multiple|Price to Sales riotblockchain.com (RIOT)|Price-to-Revenue Ratio Marathon Digital Holdings|Cipher Mining Inc - Price-to-Sales Ratio|Price-to-Revenue Ratio Core Scientific Corp (CORZ)|WULF - Price to Sales|Hut 8 Corp. - Market Cap to Revenue|Market Cap to Sales Volume BTDR (bitdeer.comm)|CLSK: Market Cap to Revenue|Market Capitalization-to-Revenue Ratio BITF (Bitfarms Ltd)|ABTC: P/S Multiple|BTBT - Price-to-Revenue Coefficient|Price-to-Revenue Ratio HIVE Digital Technologies|Market Cap to Revenue Ratio DEFT (valour.com)|P/S Multiple EXOD|Market Cap to Revenue Mercurity Fintech Holding MFH|BitFuFu Corp - Market Cap to Revenue|Price-to-Revenue Coefficient Coincheck Corp (CNCK)|Kindly MD Inc - P/S Multiple|DFDV: Price-to-Revenue Ratio|TONX (Verb Technology Company) - Market Cap to Revenue|ETHZ: Market Cap to Sales Volume|Price-to-Revenue Ratio Volcon ePowersports|Market Cap to Revenue AvalonMiner (CAN)|P/S Multiple AMBR|Market Cap to Revenue millcityventures3.com SUIG|Price-to-Revenue Ratio Know Labs USBC|Market Capitalization-to-Revenue Ratio ANTA|BTCS: Market Cap to Revenue|Price to Sales Bakkt Holdings, Inc.|X3 Holdings Co Ltd. (XTKG) - Price-to-Revenue Ratio|Price-to-Sales Ratio STKE (Sol Strategies)|Market Cap to Revenue MATH|DGXX (Digi Power X Inc.) - Market Cap to Sales Volume|Price-to-Revenue Ratio Lite Strategy Inc (LITS)|SAIH - Price to Sales|P/S Multiple HYPD (Hyperion DeFi, Inc.)|CIMG Inc. - Price-to-Revenue Ratio|BIT Mining - P/S Multiple|Price-to-Revenue Coefficient Bit Origin Ltd BTOG|ORBS (8co.holdings) - Market Cap to Revenue|EBON: Market Cap to Sales Volume|BTCT (BTC Digital Ltd) - P/S Multiple|Market Cap to Revenue greenidge.com (GREE)|Price-to-Revenue Ratio TAO Synergies Inc (TAOX)|ARBK - Price to Sales|P/S Multiple ATON (AlphaTON Capital Inc)|Price-to-Revenue Coefficient Abits Group Inc (ABTS)|FGNX - Price-to-Revenue Ratio|MIGI (mawsoninc.com) - Market Cap to Revenue Ratio|RVYL (Ryvyl) - Market Cap to Revenue|Earlyworks Co., Ltd. - Market Capitalization-to-Revenue Ratio|SBLX (StableX) - P/S Multiple|Market Cap to Revenue Ratio AGMH (AGM Group Corp)|P/S Multiple ZNB|BGIN - Price to Sales|Price-to-Revenue Ratio DeepGreenX Group DXG|GEMI (Gemini) - Price-to-Sales Ratio|ATNF - Price-to-Revenue Ratio|Price to Sales Digihost Corp.|GRDI (griid.com) - Market Cap to Revenue|GRYP: Market Cap to Sales Volume|Market Cap to Revenue SAI|SDIG: Market Capitalization-to-Revenue Ratio