EBON: Ebang International Holdings Price-to-Revenue Coefficient

Symbol and logo of brand Ebang International Holdings (EBON)

Ebang International monetizes its own patents and engineering expertise in creating blockchain infrastructure. Chip design is conducted in China, while wafer fabrication is outsourced to mitigate risks. However, cash deficits and losses are depleting capital. The price-to-sales ratio on the GURU.Markets chart demonstrates the real-time valuation, where 1.50 is the company's current P/S level.

EBON (Ebang) Market Cap to Revenue history from 07/04/2022 to 11/13/2026

Metric breakdowns and analytics for Ebang International Holdings (EBON)
- share price and consensus valuation forecast:
Fundamental company analysis:ebang.com.cn (EBON)
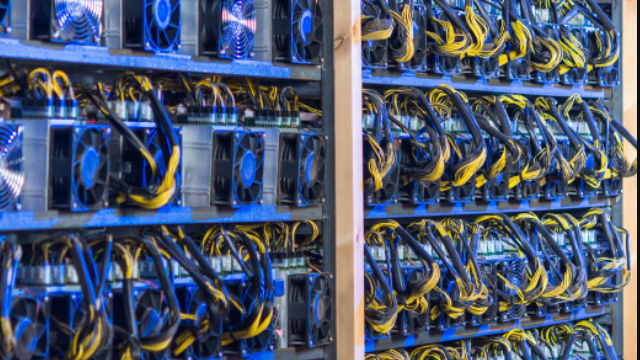
Mass-produced product of Ebang

The P/S multiple determines the market value of one dollar of revenue, allowing for an assessment of an asset's undervaluation relative to its operating sales. This value is sensitive to quarterly reports, as any fluctuations in income instantaneously alter the capitalization ratio. By analyzing the price-to-sales ratio, an investor can discern the efficiency of resource monetization. For Ebang International (EBON), this metric reflects the success of scaling ASIC miner production and the development of crypto exchanges as part of its expansion.

Competing companies

COIN (coinbase.com) - Market Capitalization-to-Revenue Ratio|P/S Multiple CRCL (Circle)|Price-to-Revenue Coefficient Iris Energy Ltd (IREN)|BMNR - Price-to-Revenue Ratio|BLSH (Bullish Corp) - Market Cap to Revenue Ratio|FIGR (Figure Technology Solutions) - Market Cap to Revenue|RIOT: Market Cap to Sales Volume|MARA (Marathon Digital Holdings) - P/S Multiple|Price to Sales Cipher Mining Inc CIFR|Price-to-Revenue Ratio Core Scientific Corp (CORZ)|WULF (TeraWulf Mining) - Market Capitalization-to-Revenue Ratio|Price-to-Revenue Ratio Hut 8 Corp. HUT|BTDR: Market Cap to Revenue Ratio|CleanSpark - P/S Multiple|BITF - P/S Multiple|ABTC (American Bitcoin Corp.) - Market Cap to Revenue|BTBT: Market Cap to Sales Volume|HIVE (HIVE Digital Technologies) - P/S Multiple|valour.com (DEFT) - Price-to-Revenue Coefficient|Price-to-Revenue Ratio Exodus (EXOD)|MFH - Price to Sales|Price-to-Revenue Ratio BitFuFu Corp FUFU|CNCK: Market Cap to Revenue Ratio|Kindly MD Inc - P/S Multiple|DFDV - P/S Multiple|Verb Technology Company (TONX) - Price-to-Revenue Ratio|ETHZ (180 Life Sciences Corp.) - Price-to-Revenue Ratio|EMPD (Volcon ePowersports) - P/S Multiple|Price to Sales AvalonMiner CAN|P/S Multiple AMBR|Price-to-Revenue Ratio SUIG (millcityventures3.com)|Price-to-Revenue Ratio Know Labs USBC|Antalpha Platform (ANTA) - Price to Sales|BTM - Price-to-Revenue Ratio|BTCS (BTCS Inc) - Market Cap to Revenue Ratio|BKKT: P/S Multiple|Market Cap to Revenue x3holdings.com|Price-to-Revenue Ratio Sol Strategies, Inc.|MATH: Market Capitalization-to-Revenue Ratio|Market Cap to Revenue DGXX (Digi Power X Corp)|LITS - Price to Sales|Price-to-Revenue Ratio SAIHEAT SAIH|HYPD (hyperiondefi.com) - Price-to-Sales Ratio|IMG: Market Cap to Revenue|BIT Mining Ltd - Market Cap to Sales Volume|bitorigin.io (BTOG) - Price-to-Revenue Ratio|Price to Sales Eightco Holdings (ORBS)|BTCT (BTC Digital Ltd) - P/S Multiple|Price to Sales greenidge.com GREE|P/S Multiple TAOX|Price-to-Revenue Ratio ARBK (Argo Blockchain PLC)|P/S Multiple ATON (AlphaTON Capital Inc)|P/S Multiple Abits Group Inc ABTS|FGNX - Price-to-Revenue Ratio|MIGI (mawsoninc.com) - Market Cap to Revenue Ratio|RVYL: P/S Multiple|Price-to-Revenue Multiple Earlyworks Co., Ltd. ELWS|Market Cap to Revenue SBLX|AGMH: Market Capitalization-to-Revenue Ratio|P/S Multiple ZNB|Price-to-Revenue Coefficient bgin.com|Price-to-Revenue Ratio DeepGreenX Group DXG|GEMI: Market Cap to Revenue Ratio|ATNF: Market Cap to Revenue|Digihost Corp. - Market Cap to Sales Volume|GRDI: P/S Multiple|Price to Sales Gryphon Digital Mining, Inc. (GRYP)|Price-to-Revenue Ratio SAI.TECH Global Inc.|SDIG: Market Capitalization-to-Revenue Ratio