DDD - 3D Systems Corp P/S Multiple

Corporate company logo of 3D Systems Corp. (DDD)

3D Systems Corporation (DDD) relies on external contractors for node assembly and global service outsourcing. The P/S multiple visualizes the market valuation trend, while the 0.70 indicator confirms the current valuation level. High sensitivity to macro shocks and capital expenditure cycles is giving way to positive momentum, as cost optimization and the closure of loss-making facilities create a foundation for a recovery in share prices.

3dsystems.com (DDD): Price-to-Revenue Ratio from 07/04/2022 to 11/13/2026

Analytical breakdowns for 3D Systems Corporation (DDD)
- market value and analyst target forecast:
Fundamental company analysis:3D Systems Corp (DDD)
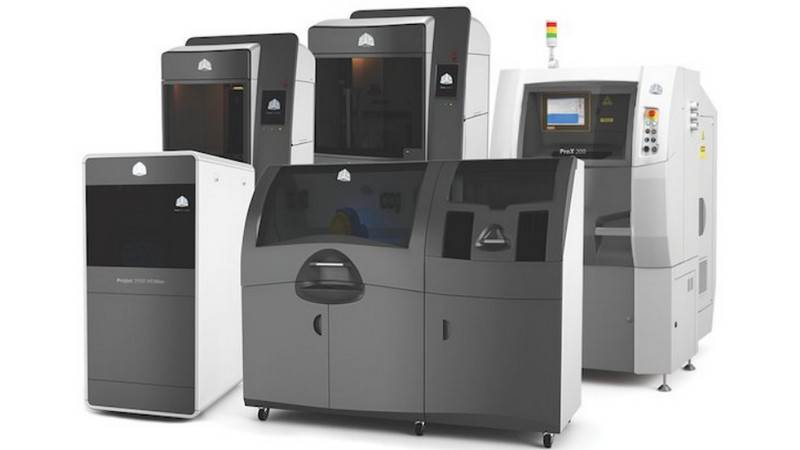
Original product of 3D Systems Corp.

3D Systems Corporation (DDD) supplies high-precision equipment and software for the aerospace and medical sectors, generating revenue from the sale of printers and consumables. The ratio of market capitalization to these sales determines the value of each dollar of revenue; therefore, fluctuations in the P/S multiple allow investors to timely recognize asset overvaluation and the risk of a correction when market optimism begins to outpace actual business growth rates.

Who 3D Systems Corporation competes with

honeywell.com (HON) - Price-to-Revenue Multiple|Parker - Market Cap to Revenue|P/S Multiple Emerson Electric EMR|Roper Industries - P/S Multiple|Price-to-Revenue Coefficient Vertiv Co. VRT|AMETEK, Inc. (AME) - Price-to-Revenue Ratio|Price-to-Sales Ratio ROK (rockwellautomation.com)|Price-to-Revenue Ratio Ingersoll Rand|Market Cap to Revenue Keysight Technologies, Inc. (KEYS)|P/S Multiple CW|SNA - Price to Sales|Price-to-Revenue Ratio Coherent Corp. COHR|FTV: Market Cap to Revenue Ratio|ZBRA: Market Cap to Revenue|Watsco Inc - Market Cap to Sales Volume|WWD (Woodward Corp) - Market Cap to Revenue|Graco Inc. (Fluid Automation) (GGG) - P/S Multiple|Market Cap to Revenue Ratio ITT Corporation (ITT)|Market Cap to Revenue nordson.com (NDSN)|Stanley Black & Decker, Inc. (SWK) - Market Capitalization-to-Revenue Ratio|Price-to-Revenue Ratio IEX (IDEX Corp)|Price-to-Revenue Coefficient CR|AIT - Market Cap to Revenue|RRX (Regal Rexnord) - Price to Sales|DCI: Price-to-Revenue Ratio|SPX Technologies - Price-to-Revenue Coefficient|Market Cap to Revenue Avantor Inc|Modine Manufacturing Co. (MOD) - Market Cap to Sales Volume|P/S Multiple Toro Manufacturing|Cognex Corporation - Price to Sales|Price-to-Revenue Ratio FLS (flowserve.com)|JBT Marel - Market Cap to Revenue|ESAB Group - Price-to-Revenue Ratio|Price-to-Revenue Coefficient MSA (Mine Safety Appliances)|Timken Bearings (TKR) - Market Cap to Revenue|Market Capitalization-to-Revenue Ratio Sensata Technologies ST|bradyid.com (BRC) - P/S Multiple|Market Cap to Revenue KAI|Price-to-Revenue Ratio ATS|Standex International - Price to Sales|Price-to-Revenue Ratio PSIX (Power Solutions Corp)|Market Capitalization-to-Revenue Ratio Enerpac Tool Group|dieboldnixdorf.com - Price-to-Revenue Ratio|Price-to-Sales Ratio Blue Bird|HLIO: Price-to-Revenue Ratio|Price to Sales KMT|TNC (Tennant Corp.) - Price-to-Revenue Ratio|GIC - Market Capitalization-to-Revenue Ratio|P/S Multiple leggett.com|P/S Multiple THR|Market Cap to Revenue Stratasys Ltd SSYS|Market Cap to Sales Volume Allied Motion (ALNT)|P/S Multiple Transcat Inc. TRNS|Price-to-Revenue Coefficient KRNT (Kornit Digital Ltd.)|RR: Price-to-Revenue Ratio|Price to Sales VPG|CMCO (Columbus McKinnon Corporation) - Price-to-Revenue Ratio|Market Cap to Revenue Ratio Luxfer Group (LXFR)|P/S Multiple A2Z|Market Cap to Revenue Ratio Mayville Engineering MEC|P/S Multiple TOYO Company (TOYO)|HUHU - Market Cap to Revenue Ratio|P/S Multiple The Eastern Co. EML|Taylor Devices, Inc (TAYD) - Market Cap to Revenue Ratio|NNBR - P/S Multiple|Hurco Companies, Inc. - Price-to-Revenue Coefficient|SHMD (schmid-group.com) - Price-to-Revenue Ratio|Market Cap to Revenue Ratio Interlink Electronics, Inc. (LINK)|P/S Multiple inTEST Corp.|Market Cap to Revenue Ratio AstroNova Corp. ALOT|Market Cap to Revenue sono-tek.com SOTK|P/S Multiple DSWL (Deswell Industries, Inc.)|alsic.com - Price-to-Revenue Ratio|Price-to-Revenue Coefficient TACT (TransAct Technologies Incorporated)|Laser Photonics Corp (LASE) - Market Cap to Revenue|TRSG - Market Cap to Sales Volume|TRT (Trio-Tech International, Inc.) - Price-to-Revenue Ratio|ELSE - Market Capitalization-to-Revenue Ratio|P/S Multiple INLIF Corp|CVR (Chicago Rivet & Machine Co.) - Price-to-Revenue Coefficient|P/S Multiple Desktop Metal Inc. (DM)|P/S Multiple FARO (FARO Technologies, Inc.)|JBT Corporation - Price-to-Revenue Ratio|MKFG - Price-to-Revenue Ratio|servotronics.com (SVT) - Market Cap to Revenue|Market Capitalization-to-Revenue Ratio ToughBuilt TBLT|Velo3D (VLD) - P/S Multiple|Price to Sales HOLI (Hollysys)