JBT - JBT Corporation P/S Multiple

Corporate company logo of John Bean Tech (JBT)

The price-to-sales valuation on the GURU.Markets dynamic chart demonstrates the impact of food line automation and the aviation sector, where the 1.60 mark characterizes this parameter for John Bean Technologies (JBT). The business relies on the reliability of processing systems and long-term airport contracts. Rising orders for electrical equipment are stimulating demand, while a global scaling strategy following a major merger solidifies the company's industry leadership.

jbtc.com (JBT): Price-to-Revenue Ratio from 07/04/2022 to 11/13/2026

Analytical breakdowns for John Bean Technologies (JBT)
- market value and analyst target forecast:
Fundamental company analysis:JBT Corporation (JBT)
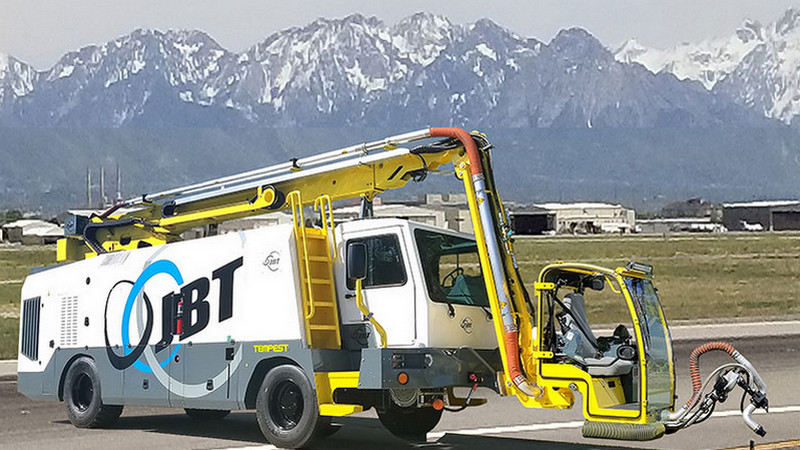
Original product of John Bean Tech

The P/S multiple compares a business's market capitalization to its total revenue, allowing for an assessment of the value of each unit of revenue and the identification of an overbought asset. By analyzing the P/S time series, an investor determines whether the price is fair relative to the sales volumes of food processing systems and ground aviation equipment, which are the specialties of John Bean Technologies (JBT).

Who John Bean Technologies competes with

honeywell.com (HON) - Price-to-Revenue Multiple|Parker - Market Cap to Revenue|P/S Multiple Emerson Electric EMR|Roper Industries - P/S Multiple|Price-to-Revenue Coefficient Vertiv Co. VRT|AMETEK, Inc. (AME) - Price-to-Revenue Ratio|Price-to-Sales Ratio ROK (rockwellautomation.com)|Price-to-Revenue Ratio Ingersoll Rand|Market Cap to Revenue Keysight Technologies, Inc. (KEYS)|P/S Multiple CW|SNA - Price to Sales|Price-to-Revenue Ratio Coherent Corp. COHR|FTV: Market Cap to Revenue Ratio|ZBRA: Market Cap to Revenue|Watsco Inc - Market Cap to Sales Volume|Woodward Corp (WWD) - Price-to-Revenue Ratio|GGG: Market Cap to Sales Volume|Price-to-Revenue Ratio ITT Corporation|Price to Sales nordson.com NDSN|P/S Multiple SWK|IEX (IDEX Corp) - Market Capitalization-to-Revenue Ratio|Price-to-Revenue Ratio Crane Corp CR|AIT: Market Cap to Revenue Ratio|RRX: Market Cap to Revenue|Market Capitalization-to-Revenue Ratio DCI (donaldson.com)|SPXC: P/S Multiple|AVTR (Avantor Inc) - Price-to-Revenue Ratio|MOD (Modine Manufacturing Co.) - P/S Multiple|Price to Sales Toro Manufacturing TTC|P/S Multiple CGNX|P/S Multiple flowserve.com (FLS)|Price-to-Revenue Ratio JBT Marel JBTM|ESAB: Market Cap to Revenue Ratio|MSA: Market Cap to Revenue|Market Capitalization-to-Revenue Ratio TKR (Timken Bearings)|ST (Sensata Technologies) - Market Cap to Revenue|BRC: Market Cap to Sales Volume|KAI (Kadant) - P/S Multiple|Price to Sales ATS Corp ATS|P/S Multiple SXI|Market Cap to Revenue Power Solutions Corp PSIX|P/S Multiple EPAC (Enerpac Tool Group)|Market Capitalization-to-Revenue Ratio DBD|BLBD - Price-to-Revenue Ratio|HLIO (Helios Technologies Inc) - Market Cap to Revenue Ratio|Kennametal Corp (KMT) - Price-to-Revenue Ratio|Price to Sales Tennant Corp. (TNC)|Price-to-Revenue Ratio Global Industrial|Price-to-Revenue Ratio LEG|Price-to-Revenue Ratio Thermon (THR)|SSYS - Price to Sales|P/S Multiple ALNT (Allied Motion)|Price-to-Revenue Multiple Transcat Inc.|Kornit Digital Ltd. - P/S Multiple|Price-to-Revenue Coefficient richtechrobotics.com RR|VPG: P/S Multiple|Price to Sales Columbus McKinnon Corporation (CMCO)|Price-to-Revenue Ratio Luxfer Group|A2Z (AZ) - Price-to-Revenue Coefficient|Price-to-Revenue Ratio Mayville Engineering (MEC)|Market Cap to Sales Volume DDD|P/S Multiple TOYO (TOYO Co., Ltd)|HUHUTECH International Group Inc. - Price-to-Revenue Ratio|EML: Market Cap to Revenue|Taylor Devices Inc - Market Cap to Sales Volume|NNBR: P/S Multiple|HURC - Price-to-Revenue Coefficient|Price-to-Revenue Ratio SCHMID Group|Market Cap to Revenue Ratio LINK (Interlink Electronics Inc)|P/S Multiple INTT|AstroNova Corp - Market Cap to Revenue Ratio|Sono-Tek - Market Cap to Revenue|P/S Multiple Deswell Industries Inc. DSWL|CPSH - Price-to-Revenue Ratio|Price-to-Revenue Coefficient TransAct Technologies Inc. TACT|LASE (laserphotonics.com) - Market Cap to Revenue|TRSG: Market Cap to Sales Volume|Price-to-Revenue Ratio Trio-Tech|ELSE: Market Capitalization-to-Revenue Ratio|P/S Multiple INLF|Price-to-Revenue Coefficient Chicago Rivet & Machine Co|P/S Multiple DM (Desktop Metal, Inc)|P/S Multiple faro.com FARO|MKFG - Price-to-Revenue Ratio|SVT: Price-to-Revenue Ratio|TBLT (ToughBuilt) - Market Cap to Revenue|Velo3D - Market Capitalization-to-Revenue Ratio|HOLI (Hollysys) - P/S Multiple