Forward P/S Multiple: Deluxe Corporation (DLX)
DLX (deluxe.com) - company brandmark

High margins for Deluxe Corporation (DLX) are driven by the implementation of AI automation and cloud-based HR systems. The forward P/S history clearly demonstrates the dynamics of market expectations, where 0.20 determines the current value of the metric. Payment services and marketing support for small businesses act as a steady cash generator. A successful transition to a B2B platform model has solidified the brand's status as a reliable technological partner.

DLX deluxe.com: Market Cap to Projected Revenue in the range 07/04/2022 - 11/15/2026

Deluxe Corporation - analytical breakdowns and key metrics (DLX)
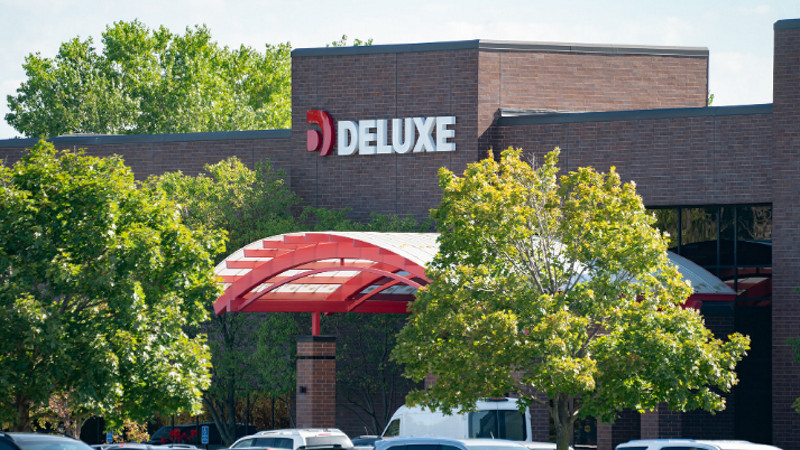
- current price and projected stock value:
- company stock exchange capitalization indicators:
Initial company analysis:DLX (Deluxe Corp.)
Product sample of Deluxe Financial Services

This metric is calculated by dividing the current market capitalization by projected sales volume, determining market expectations for future revenues. It measures investors' willingness to pay a premium for business expansion potential and model scalability. For Deluxe Corporation (DLX), the stability of North American infrastructure mitigates risks, making the projected price-to-sales ratio an indicator of confidence in sustainable growth. Analyzing this curve allows for an assessment of whether the stock price is adequate relative to actual expansion rates.

Who Deluxe Corporation competes with

Price-to-Projected Revenue Ratio Cintas Corp. CTAS|TRI - Forward Price-to-Revenue Multiple|hl.com - Forward P/S Multiple|Market Cap to Expected Sales Ratio boozallen.com BAH|Rentokil (RTO) - Price-to-Projected Revenue Ratio|EXLS - Market Cap to Expected Sales Ratio|PJT (PJT Partners Inc) - Forward P/S Multiple|Forward Price-to-Revenue Multiple Moelis Corp (MC)|Forward P/S Multiple FCN|Concentrix Corporation (CNXC) - Projected Price to Revenue|Forward P/S Multiple EXPO (Exponent Corp)|WNS: Market Cap to Projected Revenue|CBIZ Financial - Forward P/S Multiple|ABM Industries Inc. (ABM) - Forward Price-to-Revenue Multiple|Acuren Corporation Ltd (TIC) - Price-to-Projected Revenue Ratio|LZ (LegalZoom) - Price-to-Projected Revenue Ratio|Forward Price-to-Revenue Multiple ICFI|Forward P/S Multiple TaskUs Corp|Forward P/S Multiple WLDN|Market Cap to Expected Sales Ratio CRA Corp|TELUS International - Forward Price-to-Revenue Multiple|Forward Price to Sales PHLT|Hackett Group - Forward P/S Multiple|Market Cap to Expected Sales Ratio IBEX Ltd IBEX|ANPA: Forward P/S Multiple|XRX (Xerox) - Price-to-Projected Revenue Ratio|Forward Price-to-Revenue Multiple CNDT|Kingsway Financial Services - Future Price to Revenue|Forward Price-to-Revenue Multiple INV (Innventure)|Market Cap to Expected Sales Ratio Open Lending Corp.|Price-to-Projected Revenue Ratio RCM Tech RCMT|TTEC: Market Cap to Projected Revenue|RGP - Price-to-Projected Revenue Ratio|EGG (enigmatig.com) - Market Cap to Projected Revenue|TISI: Forward P/S Multiple|PMEC - Market Cap to Expected Sales Ratio|Price-to-Projected Revenue Ratio issuerdirect.com|Forward Price-to-Revenue Multiple Harte Hanks, Inc. (HHS)|Forward P/S Multiple RYOJ|SPPL: Future Price to Revenue|Price-to-Projected Revenue Ratio Greenpro GRNQ|Forward P/S Multiple Top KingWin Limited WAI|Quhuo Ltd. - Forward P/S Multiple|PMAX - Forward P/S Multiple|LICN (Lichen China Ltd.) - Forward Price-to-Revenue Multiple|BMHL - Market Cap to Expected Sales Ratio|Forward Price-to-Revenue Multiple ZGM|FOFO - Projected Price to Revenue|Price-to-Projected Revenue Ratio ARC Corp (ARC)|Price to Expected Revenue Ratio GVP|Price to Expected Revenue Ratio NV5 Corp (NVEE)|PFMT (Performant Financial) - Future Price to Revenue|STER: Forward Price-to-Revenue Multiple|TDCX Inc - Price to Expected Revenue Ratio