Dorman (DORM): Market Cap to Revenue

Brandmark of Dorman Products Inc (DORM)

The price-to-sales ratio for Dorman Products, Inc. (DORM) reflects the business valuation trend, where the parameter is 1.80. Large retail chains are putting pressure on margins, and demand in the DIY segment may decline. Dorman Products, Inc. (DORM) possesses a unique component base, creating retailer dependence on its B2B channels. Revenues are driven by vehicle fleet aging, which guarantees steady interest in affordable aftermarket parts.

Price-to-Revenue Ratio: Dorman (DORM) for 07/04/2022 - 11/16/2026

Metric breakdowns and analytics for Dorman Products Inc (DORM)
- share price and consensus valuation forecast:
- stock exchange capitalization data:
Fundamental company analysis:Dorman, DORM
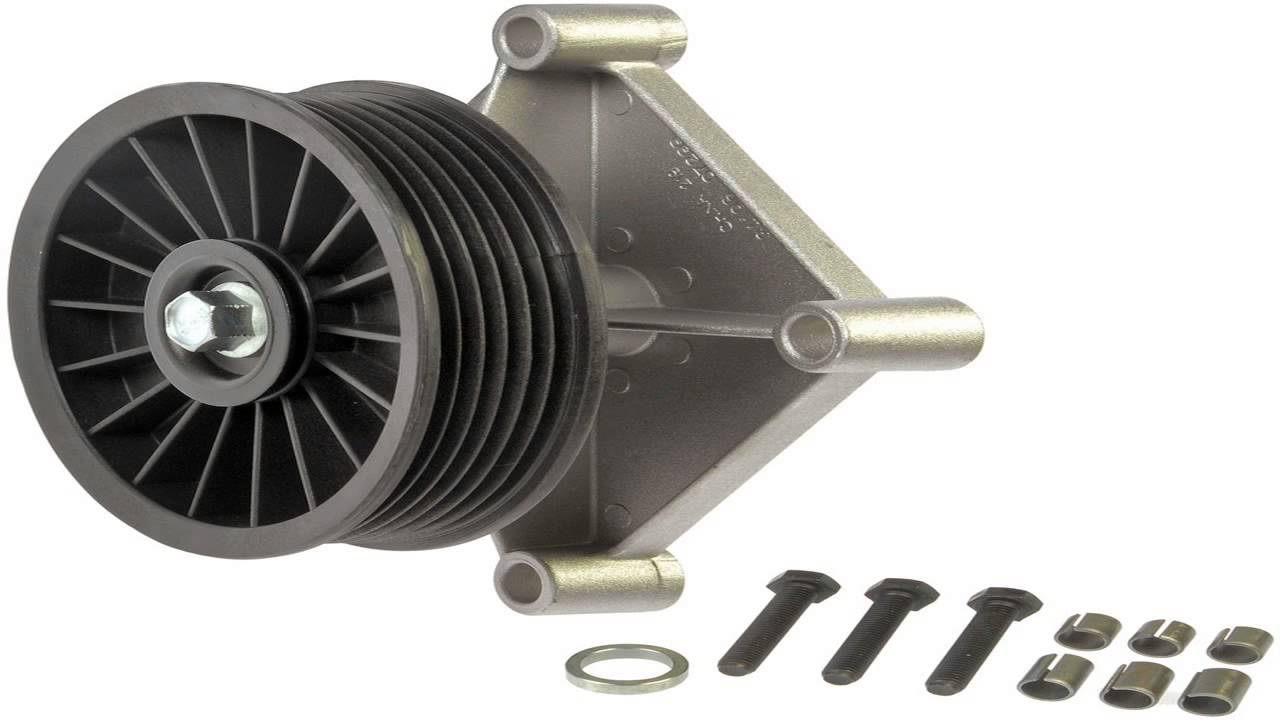
Finished products of Dorman

The P/S ratio determines the market value of a business relative to its annual revenue, allowing for an assessment of the premium paid for each unit of sales. By analyzing the P/S time series, an investor can see the ratio of market capitalization to actual cash flows, which is critically important for Dorman Products, Inc. (DORM), whose revenues are growing due to the aging US vehicle fleet and the protection of right-to-repair laws.

Competitors of Dorman Products, Inc.

ORLY - Price to Sales|AutoZone - Market Cap to Revenue|Price-to-Revenue Coefficient Cummins Engine (CMI)|GPC - Price-to-Revenue Ratio|Market Capitalization-to-Revenue Ratio MGA (Magna International Inc.)|RBC: P/S Multiple|ALV (Autoliv Corp) - Price-to-Revenue Ratio|Price-to-Revenue Ratio BorgWarner Inc.|lkqcorp.com - Price-to-Sales Ratio|Market Cap to Revenue ALSN (Allison Transmission)|LEA: Price-to-Sales Ratio|Valvoline - Market Cap to Revenue|P/S Multiple Atmus Filtration Technologies ATMU|AAP: Market Cap to Revenue|DRVN - P/S Multiple|Dana Inc. (DAN) - Price-to-Revenue Ratio|GTX - Price-to-Revenue Coefficient|Market Cap to Revenue GT|PHINIA - Price-to-Sales Ratio|Market Cap to Revenue ADNT (Adient plc)|FOXF (Fox Factory Holding Corp) - Market Capitalization-to-Revenue Ratio|P/S Multiple XPEL (XPEL Corp)|Market Capitalization-to-Revenue Ratio SMP|AXL - Price-to-Revenue Ratio|Market Capitalization-to-Revenue Ratio CPS (Cooper-Standard Holdings)|MNRO (Monro Auto Service) - Market Cap to Revenue|Holley Inc. (HLLY) - P/S Multiple|MPAA (Motorcar Parts Corp) - P/S Multiple|CAAS: Market Capitalization-to-Revenue Ratio|P/S Multiple MTEN|Price-to-Revenue Coefficient Sypris Solutions|Price-to-Revenue Ratio CarParts com, Inc. PRTS|Westport Fuel Systems (WPRT) - Price to Sales|WKSP: Market Cap to Revenue|INEO (INNEOVA Holdings Ltd) - Market Cap to Revenue Ratio|CREV (Carbon Revolution plc) - Market Cap to Revenue|Price-to-Sales Ratio SUP (Superior Industries International)|Price-to-Revenue Ratio sag.sg