Forward P/S Multiple: Dorman Products Inc (DORM)

Corporate emblem and logo of Dorman (DORM)

Dorman Products, Inc. (DORM) is operating its production capacities at maximum load, while the modernization of warehouses and casting facilities continues without interruption. Revenues are driven by the aging of the global vehicle fleet and the stability of component imports. The historical forecast P/S chart reflects market expectations, where the value 1.40 describes the current level. A strong market position is maintained through the creation of affordable alternatives to original equipment, rendering the demand for spare parts inelastic.

DORM Dorman: Market Cap to Projected Revenue in the range 07/04/2022 - 11/16/2026

Financial and market metric breakdowns for dormanproducts.com (DORM)
- market price and analyst price targets:
- company stock exchange capitalization indicators:
Summary company analysis:DORM (dormanproducts.com)
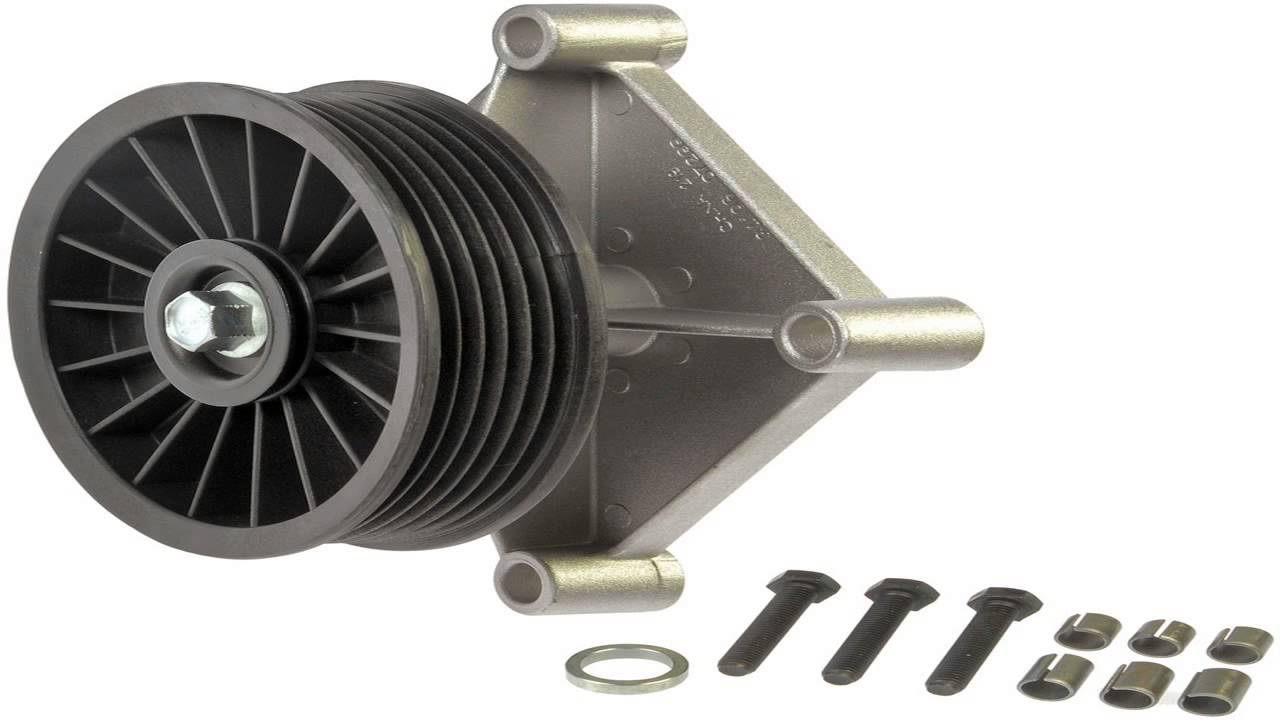
Original product of Dorman Products, Inc.

The forward P/S reflects the ratio of current market capitalization to expected annual sales volume, allowing investors to assess the business value relative to its future cash flows. By analyzing the forward P/S multiple of 1.40, one can determine the degree of overvaluation for Dorman Products, Inc. (DORM), whose revenues depend on the demand for aftermarket auto parts and electronics.

Competitor analysis

Forward P/S Multiple ORLY (O'Reilly Auto)|AZO (AutoZone Stores) - Future Price to Revenue|CMI - Price-to-Projected Revenue Ratio|GPC (Genuine Parts Company) - Market Cap to Projected Revenue|MGA: Forward P/S Multiple|RBC Bearings Inc. (RBC) - Forward P/S Multiple|Forward Price-to-Revenue Multiple ALV|Market Cap to Projected Revenue BWA (BorgWarner Corp)|Price-to-Projected Revenue Ratio LKQ Corporation (LKQ)|ALSN (Allison Transmission Holdings, Inc.) - Forward Price to Sales|Price-to-Projected Revenue Ratio Lear Automotive LEA|Forward Price to Sales VVV|Atmus Filtration Technologies Inc. - Forward P/S Multiple|Advance Auto - Price to Expected Revenue Ratio|Driven Brands (DRVN) - Price-to-Projected Revenue Ratio|Market Cap to Future Revenue Ratio dana.com (DAN)|Price-to-Projected Revenue Ratio Garrett Motion Inc|GT (goodyear.com) - Price to Expected Revenue Ratio|Forward P/S Multiple PHIN|Price to Expected Revenue Ratio ADNT|Price-to-Projected Revenue Ratio ridefox.com FOXF|Forward P/S Multiple xpel.com XPEL|SMP - Price-to-Projected Revenue Ratio|AXL: Price-to-Projected Revenue Ratio|CPS: Forward P/S Multiple|Monro, Inc. (MNRO) - Forward P/S Multiple|Forward Price-to-Revenue Multiple HLLY|Motorcar Parts of America, Inc. - Future Price to Revenue|Price-to-Projected Revenue Ratio caasauto.com (CAAS)|Market Cap to Expected Sales Ratio Wuxi Mingteng|Price-to-Projected Revenue Ratio Sypris Solutions, Inc. SYPR|Forward Price to Sales PRTS|WPRT - Price-to-Projected Revenue Ratio|WKSP - Forward P/S Multiple|INEO: Forward P/S Multiple|CREV (Carbon Revolution plc) - Price-to-Projected Revenue Ratio|SUP (Superior Industries International, Inc.) - Forward P/S Multiple|Market Cap to Future Revenue Ratio SAG Group SAG