Eastern International (ELOG) - Cash on Hand per Share
Eastern International Ltd actively leverages external fleets to scale during peak periods, as evidenced by the free cash flow per share chart on GURU.Markets, where 0.26 determines this parameter level. The company is developing a digital network for ground transportation and warehousing, yet excess market capacity forces ELOG to maintain low tariffs to retain major contracts.

Comprehensive metric breakdowns and analytics for Eastern International (ELOG)
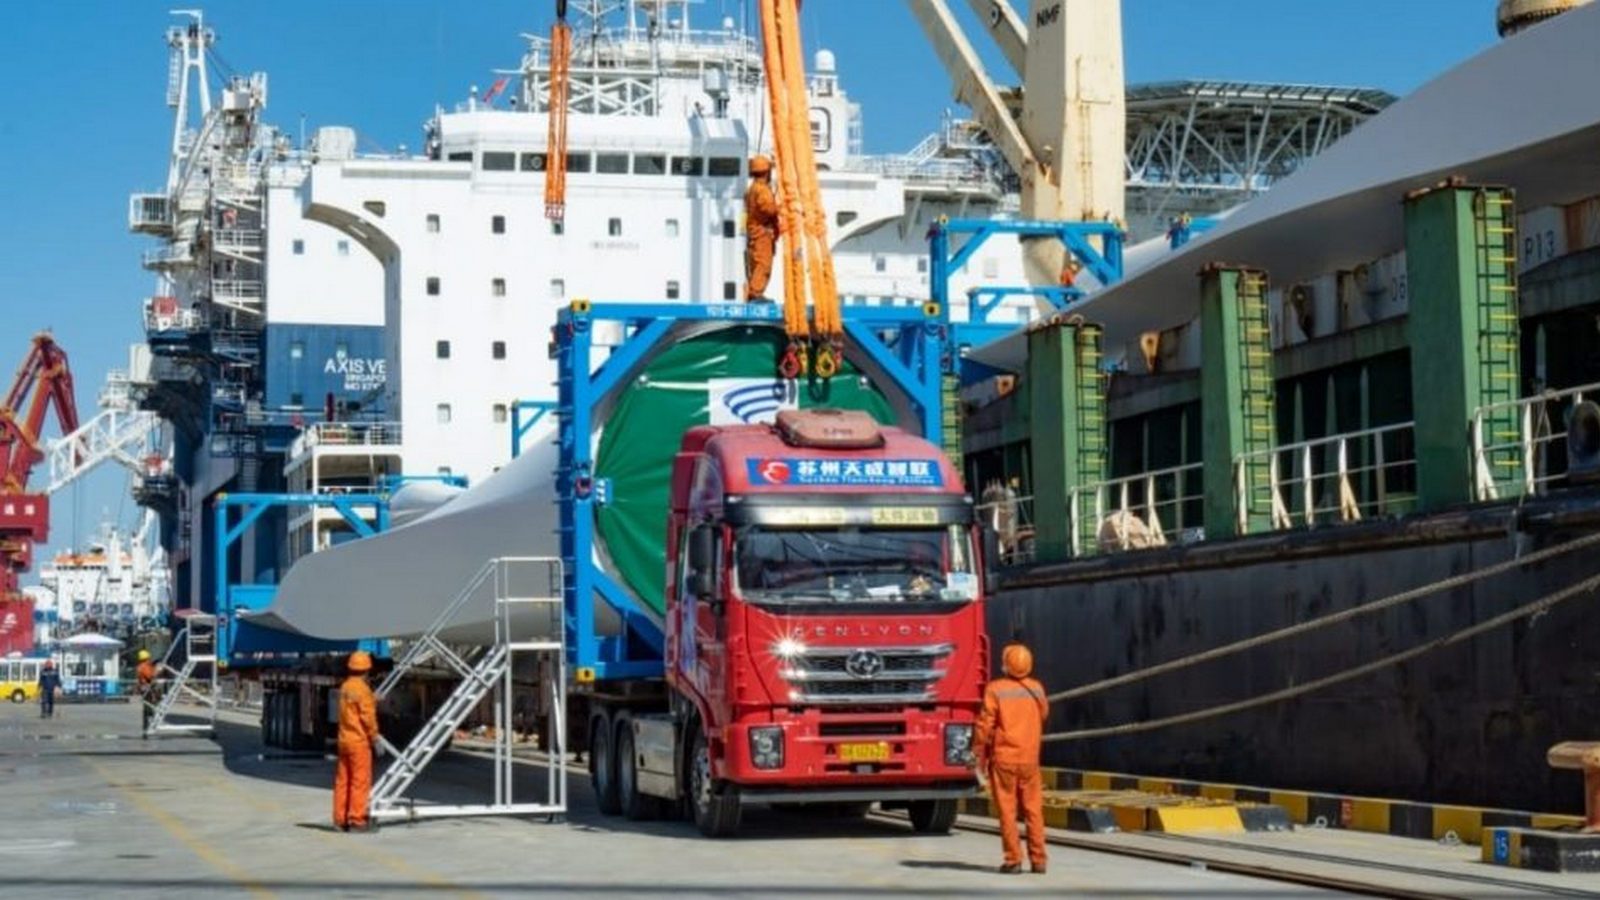
This indicator separates the fundamental stability of Eastern International Ltd (ELOG) from short-term market volatility. The metric is calculated as the difference between liquid reserves and all current liabilities on a per-share basis. By analyzing the level of liquid assets per share, an investor can observe the actual capital burn prior to the publication of financial statements. This is critical for assessing the financing of fleet expansion and the digitalization of logistics. The stability of this indicator confirms the company's ability to scale its warehouse network without compromising solvency.
