TFI International Inc. (TFII) - Cash Funds Calculated per Share

Operational efficiency and mergers are supporting share prices, as evidenced by the current liquidity per share, where 2.30 is the current level of the metric. Growth is based on scale and transport diversification, although labor shortages and fuel volatility are creating pressure. This chart reflects the financial resilience of TFI International Inc. (TFII) amid a general market downturn.

Analytical breakdowns for TFI International Inc.
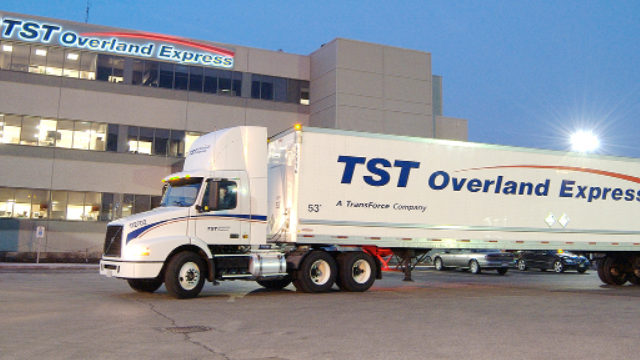
This indicator reflects the share of available liquidity per security, allowing for an assessment of financial stability and expansion potential. By analyzing the cash per share, an investor can see the resource base of TFI International Inc. (TFII), which, in the absence of proprietary R&D, serves as the primary tool for executing a strategy of aggressive third-party asset acquisitions.
