Friedman Industries, Inc. (FRD) - Net Margin

The physical scalability of Friedman Industries (FRD) is limited by plant capacities, which impacts the company's debt load. The revenue margin metric visualizes these cycles, while the value of 4.50 confirms the current yield level. Optimization is possible through reducing slab procurement costs and logistics, however, geopolitical fragmentation of raw material markets and tariff wars continue to increase the final cost of goods sold.

Friedman Industries, Inc. (FRD) - metric breakdowns and financial figures
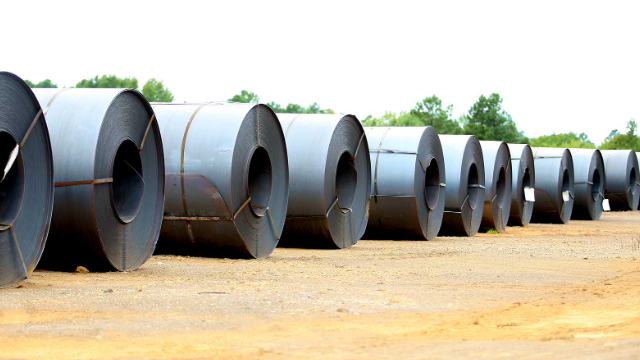
Investors are assessing the resilience of Friedman Industries (FRD) through sales margins, which measure the portion of net profit in every dollar of revenue after deducting all operating and financial expenses. By analyzing the trend of net profit margins, one can determine the effectiveness of plant modernizations in Texas and Indiana, as growth in this metric confirms the company's ability to scale steel deliveries without sacrificing profitability.
