GTIM: Good Times Restaurants Inc Company Value to Net Income

Symbol and logo of brand Good Times Restaurants Inc (GTIM)

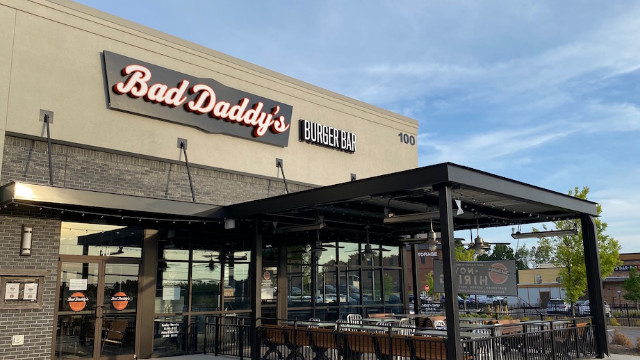
Good Times Restaurants (GTIM) management is betting on strict operational control and premium products to drive profit growth. The business relies on the success of Bad Daddy’s Burger Bar, offering gourmet meals at affordable prices in the Carolinas and Colorado. The combination of burger joints and Mexican cafes minimizes consumer risks, while the PE ratio on GURU.Markets stands at 5.90. The asset's market value dynamics clearly demonstrate the company's current financial trends.

P/E Multiple: Good Times Restaurants (GTIM) for 07/04/2022 - 11/11/2026

Comprehensive metric breakdowns and analytics for Good Times Burgers (GTIM)
- stock value and consensus price forecast:
Comprehensive company analysis:goodtimesburgers.com - GTIM
Finished products of Good Times Restaurants Inc.

The P/E ratio determines the investment payback period by comparing the current share price with the business's annual earnings to identify whether an asset is overvalued or undervalued. By analyzing the P/E volatility of Good Times Restaurants (GTIM), an investor can see how service digitalization and logistics automation convert into real profit, influencing the issuer's market value relative to its fundamental indicators.

Key competitors

Price to Earnings Ratio corporate.mcdonalds.com (MCD)|Price to Earnings Ratio SBUX (Starbucks)|CMG (Chipotle Mexican Grill, Inc.) - Company Value to Net Income|P/E Multiple YUM (Yum!)|SYY - Price to Earnings Ratio|RBI - P/E Multiple|DRI - P/E Multiple|TOST (Toast) - Price to Earnings Ratio|USFD: Market Price to Net Income Ratio|YUMC (Yum China Inc.) - P/E Multiple|Market Cap to Earnings Domino's Pizza Corp DPZ|Price to Earnings Ratio Texas Roadhouse, Inc. (TXRH)|ARMK (aramark.com) - Company Value to Net Income|P/E Multiple BROS (Dutch Bros)|Business Payback Period CAVA Group Inc (CAVA)|WING - Price to Earnings Ratio|MIDD (The Middleby) - Price to Earnings Multiple|EAT: P/E Multiple|Market Cap to Net Income Ratio shakeshack.com SHAK|CAKE (The Cheesecake Factory Incorporated) - P/E Multiple|WEN - Market Cap to Net Income Ratio|Price to Earnings Ratio Olo Platform (OLO)|PZZA - Market Cap to Earnings|Price to Earnings Ratio Arcos Dorados Holdings ARCO|br.coffee (BRCB) - Market Cap to Earnings|Super Hi International Holding Ltd. - P/E Multiple|CBRL (Cracker Barrel Old Country Store, Inc.) - Price to Earnings Multiple|SG (Sweetgreen Corp) - Price to Earnings Ratio|First Watch Inc - Company Value to Net Income|Price to Earnings Ratio BH|KRUS (kurasushi.com) - Market Price to Net Income Ratio|P/E Multiple PLAY|Business Payback Period BJ's Restaurants Inc|Price to Earnings Ratio Bloomin' Brands Inc BLMN|DNUT - Price to Earnings Ratio|Potbelly Corporation - P/E Multiple|Market Cap to Earnings karatpackaging.com|Portillo's (PTLO) - Price to Earnings Ratio|DIN - Business Payback Period|Price to Earnings Ratio JACK|LOCO: Company Value to Net Income|Price to Earnings Ratio Denny's Corporation (DENN)|TWNP (twinpeaksrestaurant.com) - Company Value to Net Income|P/E Multiple MB (MasterBeef)|Red Robin Gourmet Burgers, Inc. (RRGB) - Market Cap to Earnings|GENK - Price to Earnings Ratio|Business Payback Period ONE Group Hospitality STKS|BDL (Flanigan's Enterprises) - Price to Earnings Ratio|RAVE: Market Price to Net Income Ratio|FAT (FAT Brands Inc) - P/E Multiple|P/E Multiple Giftify Inc.|Price to Earnings Ratio NDLS (Noodles & Company, Inc.)|P/E Multiple arkrestaurants.com (ARKR)|Price to Earnings Ratio Vestand VSTD|Company Value to Net Income LBGJ|HWH International - P/E Multiple|PC - P/E Multiple|BT Brands, Inc (BTBD) - Price to Earnings Ratio|Price to Earnings Multiple HCHL|Price to Earnings Ratio BFI|CHUY (chuys.com) - Market Price to Net Income Ratio|Price to Earnings Ratio Sushi Ginza Onodera (ONDR)|Business Payback Period Pinstripes Holdings, Inc.|P/E Multiple PRST (Presto Automation Inc)|Market Cap to Net Income Ratio Yoshiharu Global Co|TWNPV: Price to Earnings Ratio