MasterBeef Group Ltd. (MB) - P/E Multiple

MasterBeef Group Limited - graphic logo of issuer MB

Margins for the Hong Kong restaurant chain MasterBeef Group (MB) are suffering due to regional political instability, rising raw material costs, and expensive rent. Inflationary pressures and potential sanitary restrictions affecting demand in China are exerting additional pressure. This price chart with the -9.40 indicator complements the analysis, while the business implements kitchen robots and digital delivery systems to optimize processes.

MB: MasterBeef Group Ltd P/E Multiple 04/11/2025 - 11/10/2026
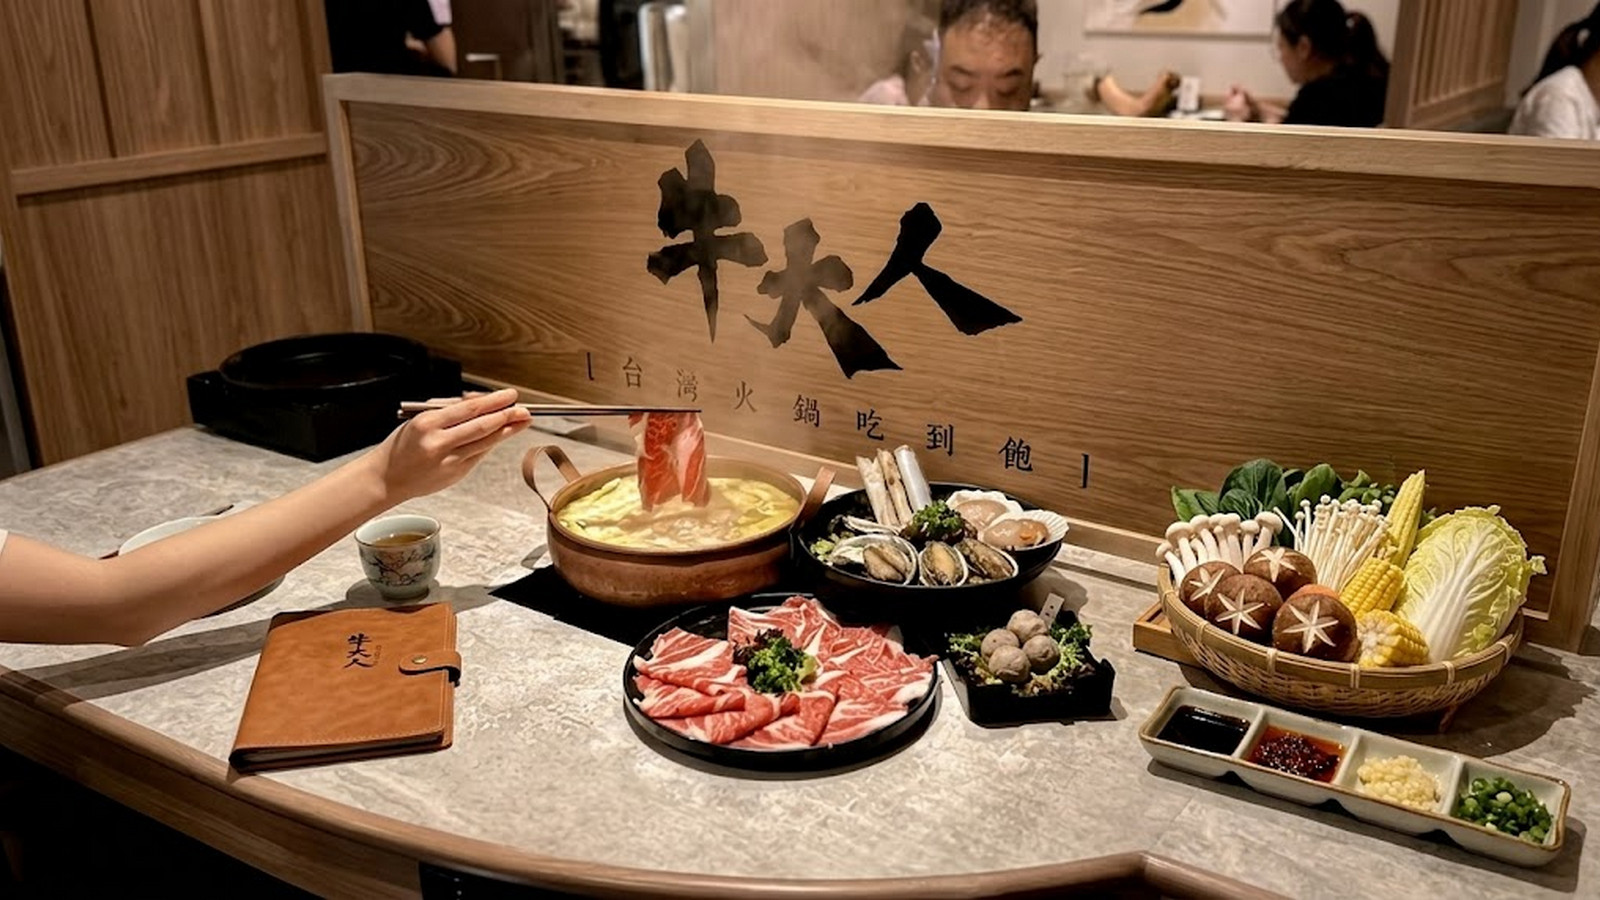
Flagship merchandise of MasterBeef Group

The P/E ratio determines the multiple of a business's market value relative to its annual net income, allowing for an assessment of the premium paid for an asset. By analyzing the P/E range of a company, an investor can identify the moment of a fair discount on shares during a decline in corporate earnings. For MasterBeef Group (MB), the absence of R&D activity and an operational plateau make this metric a critical indicator of efficiency. Stagnant innovation increases the risk of purchasing a security with declining profitability.

Key competitors

Price to Earnings Ratio corporate.mcdonalds.com (MCD)|P/E Multiple SBUX|P/E Multiple Chipotle Mexican Grill, Inc. (CMG)|Yum! - Price to Earnings Ratio|Market Price to Net Income Ratio SYY (Sysco Corp.)|RBI - P/E Multiple|Market Cap to Earnings darden.com|Toast (TOST) - Price to Earnings Ratio|US Foods Corp - Company Value to Net Income|YUMC (Yum China Inc.) - P/E Multiple|Domino's Pizza Corp (DPZ) - Business Payback Period|Price to Earnings Ratio Texas Roadhouse, Inc. (TXRH)|aramark.com - Price to Earnings Multiple|P/E Multiple BROS (Dutch Bros)|Market Cap to Net Income Ratio CAVA Group Inc|WING - Price to Earnings Ratio|The Middleby (MIDD) - Price to Earnings Ratio|EAT: P/E Multiple|shakeshack.com (SHAK) - P/E Multiple|Price to Earnings Ratio The Cheesecake Factory Incorporated|Wendy's Company (WEN) - Business Payback Period|Price to Earnings Ratio OLO (Olo Platform)|Market Price to Net Income Ratio PZZA|P/E Multiple ARCO (Arcos Dorados Holdings)|br.coffee (BRCB) - Market Cap to Earnings|HDL - Price to Earnings Ratio|Company Value to Net Income CBRL (Cracker Barrel Old Country Store, Inc.)|SG: P/E Multiple|FWRG (First Watch Inc) - Price to Earnings Ratio|BH (Biglari Holdings Inc.) - P/E Multiple|Market Cap to Earnings kurasushi.com KRUS|P/E Multiple PLAY|BJRI - Market Cap to Earnings|P/E Multiple BLMN (Bloomin' Brands Inc)|DNUT (Krispy Kreme Corp) - Market Cap to Net Income|PBPB: Price to Earnings Ratio|Company Value to Net Income KRT (karatpackaging.com)|PTLO: P/E Multiple|Market Cap to Net Income Ratio IHOP DIN|Price to Earnings Ratio Jack in the Box Corp|LOCO: Company Value to Net Income|Price to Earnings Ratio Denny's Corporation (DENN)|TWNP - Market Cap to Earnings|Red Robin - Price to Earnings Ratio|P/E Multiple GEN Restaurant Group Inc GENK|STKS - Price to Earnings Ratio|Market Cap to Net Income BDL|Rave Restaurant Group, Inc. (RAVE) - Price to Earnings Ratio|Price to Earnings Ratio FAT Brands|GIFT (Giftify) - P/E Multiple|Price to Earnings Ratio NDLS|Price to Earnings Ratio Ark Restaurants Corp. (ARKR)|VSTD: Market Cap to Net Income|Li Bang International - Price to Earnings Ratio|P/E Multiple hwhintl.com HWH|Good Times Restaurants Inc. - P/E Multiple|PC: Price to Earnings Ratio|BT Brands, Inc (BTBD) - Price to Earnings Ratio|HCHL (Happy City Holdings) - Price to Earnings Ratio|BFI (BurgerFi International) - P/E Multiple|chuys.com (CHUY) - Business Payback Period|P/E Multiple ONDR|Price to Earnings Ratio Pinstripes Holdings, Inc. PNST|Presto Automation Inc - Price to Earnings Ratio|Company Value to Net Income YOSH|Twin Hospitality Group - P/E Multiple