Haynes International, Inc. (HAYN) - Net Sales Margin

Brandmark of Haynes International, Inc. (HAYN)

Haynes International (HAYN) relies on engineering expertise and labor union stability. The average sales margin, where the current status equals 6.10, links human capital potential with skilled management expanding the aircraft engine customer base. Business efficiency is bolstered by the implementation of AI sensors and laser scanning within automated rolling mills, optimizing the production of heat-resistant alloys.

Haynes International Inc. (HAYN) Company Sales Margin: for the period 07/04/2022 - 11/30/2024

Summary analytical data breakdowns for Haynes International, Inc. (HAYN)
- market value and analyst target forecast:
Summary company analysis:Haynes International Inc., HAYN
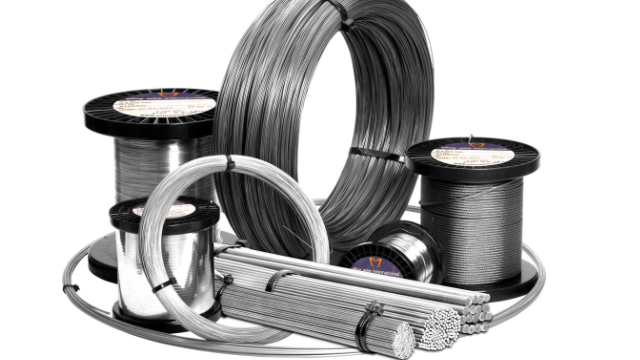
Flagship merchandise of haynesintl.com

Selecting stocks with a high margin of safety begins with an analysis of profit extraction efficiency. This metric determines the share of net income in each unit of revenue, measuring final profitability after all expenses. For Haynes International (HAYN), this indicator confirms the monetization of the exclusivity of alloys that have been in demand by the aerospace industry for decades. The stability of relative net profit from sales testifies to the quality of capital management. The trend along this curve allows for an assessment of business resilience.

Competitor analysis for Haynes International

BHP: Net Sales Margin|SCCO: Company Net Profitability|RIO (Rio Tinto Corp) - Net Sales Margin|Net Margin Freeport Corp FCX|Net Margin Teck Resources Limited (TECK)|Return on Sales by Net Profit Pan American Silver PAAS|Net Sales Margin MP (MP Materials Corp)|Company Sales Margin Allegheny Technologies Incorporated (ATI)|AA - Net Margin|Company Sales Margin Hudbay Mining HBM|BVN (Buenaventura Corp) - Return on Sales by Net Profit|Net Profit Margin AZZ (AZZ Inc.)|Net Margin Century Aluminum Company|Return on Sales by Net Profit Materion Corp (MTRN)|Net Sales Margin TMC|Return on Sales by Net Profit Constellium SE CSTM|Net Margin Skeena Resources Limited SKE|erocopper.com (ERO) - Net Margin|KALU - Net Margin|Company Sales Margin Ivanhoe Electric IE|PRLB: Net Sales Margin|TGB - Company Sales Margin|ALM (almonty.com) - Net Sales Margin|Return on Sales by Net Profit Solaris Resources Inc. (SLSR)|Return on Sales by Net Profit LAC (Lithium Americas)|US Antimony Corp - Net Return on Sales|Nexa Resources Group - Return on Sales by Net Profit|Sigma Lithium Inc. - Net Margin|SLI: Return on Sales by Net Profit|LAR - Net Sales Margin|Pebble Project (NAK) - Net Margin|EMX: Company Net Profitability|Net Margin NioCorp|Net Margin New Pacific Metals NEWP|Net Sales Margin LZM|trilogymetals.com (TMQ) - Net Profitability Margin|Net Sales Margin WRN (Western Copper and Gold Corp)|Net Sales Margin ioneer Ltd IONR|NAMM - Net Margin|BOOM - Net Sales Margin|LODE: Net Sales Margin|Net Return on Sales NEXM|Net Margin Atlas Lithium Corporation|Net Sales Margin Westwater Resources Inc.|Return on Sales by Net Profit FMST (Foremost Lithium Resources & Technology Ltd.)|Company Net Profitability LITM|Net Margin Electra Battery Materials ELBM|BURU: Net Return on Sales|CHNR - Net Margin|Net Margin Aqua Metals Inc.|ELVR: Net Sales Margin|AMLI: Company Net Profitability|Net Margin Lithium Americas Corp|Return on Sales by Net Profit piedmontlithium.com (PLL)