MP Materials Corp. - MP Net Sales Margin

Graphic logo of MP Materials (MP)

MP Materials Corp. (MP) owns a strategic rare earth deposit in the US, developing the production of magnets for electric vehicles with government support. High operating leverage is currently constrained by price volatility and processing costs. Financial sales margins visualize these processes, and the parameter has stabilized at -7.60. Optimized ore logistics to the plants minimize transportation expenses, supporting overall efficiency.

MP Materials Group (MP) Net Profit Rate: for the period 07/04/2022 - 11/19/2026

MP (MP Materials Group): analytical breakdowns and indicator data
- share price and consensus valuation forecast:
Fundamental valuation:MP Materials Corp.
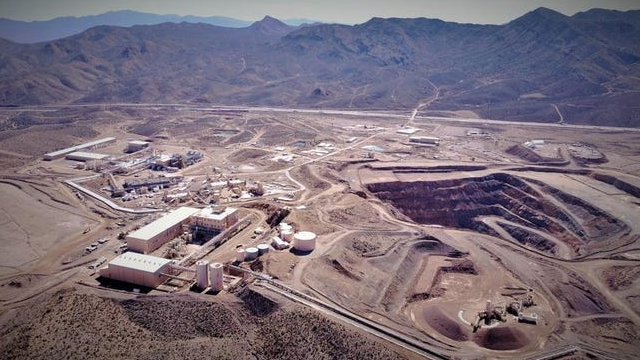
Flagship merchandise of MP Materials Inc.

Investors utilize this screening to assess operational efficiency and the business's ability to convert revenue into actual profit. The -7.60 metric, reflecting net income per unit of sales, measures the profit margin after all expenses, which for MP Materials Corp. (MP), a Pentagon-backed strategic supplier of rare earth metals, confirms the financial sustainability of its geopolitical mission through the lens of this chart.

Competitors of MP Materials Corp. (MP)

BHP: Net Sales Margin|SCCO: Company Net Profitability|RIO (Rio Tinto Corp) - Net Sales Margin|Net Margin Freeport Corp FCX|Net Margin Teck Resources Limited (TECK)|Return on Sales by Net Profit Pan American Silver PAAS|atimetals.com - Return on Sales by Net Profit|Net Profit Rate AA|Hudbay Mining - Net Sales Margin|Buenaventura - Company Net Profitability|AZZ (AZZ Inc) - Return on Sales by Net Profit|centuryaluminum.com (CENX) - Net Sales Margin|MTRN (Materion Corp) - Net Sales Margin|TMC (metals.co) - Company Net Profitability|Net Margin Constellium Group (CSTM)|Net Sales Margin Skeena Corp (SKE)|Net Margin Ero Copper Corp ERO|Company Sales Margin kaiseraluminum.com (KALU)|Ivanhoe Electric Inc - Net Sales Margin|PRLB (Proto Labs) - Net Return on Sales|TGB: Net Sales Margin|Almonty - Net Profit Rate|SLSR (solarisresources.com) - Net Sales Margin|Lithium Americas (LAC) - Company Sales Margin|Net Margin US Antimony Corp (UAMY)|Company Sales Margin Nexa Corp|Net Margin Sigma Lithium Resources SGML|Standard Lithium Ltd. - Net Margin|Lithium Argentina Inc. - Net Sales Margin|Company Sales Margin northerndynastyminerals.com NAK|EMX (EMX Royalty Corporation) - Return on Sales by Net Profit|NioCorp Developments Ltd - Net Profit Rate|NEWP (newpacificmetals.com) - Net Sales Margin|LZM (Lifezone Metals Corp) - Company Net Profitability|Net Margin NovaCopper (TMQ)|Net Margin WRN (Western Copper and Gold)|Net Sales Margin IONR (ioneer.com)|Net Sales Margin Namib Minerals Corporation NAMM|DMC Global, Inc. - Net Sales Margin|Net Profit Rate LODE (comstockmining.com)|NEXM (NexMetals Mining Corp) - Return on Sales by Net Profit|Return on Sales by Net Profit Atlas Lithium Corp.|WWR (westwaterresources.net) - Net Sales Margin|Net Margin FMST|Return on Sales by Net Profit LITM (Snow Lake Resources)|ELBM - Net Margin|Net Margin nuburu.net BURU|Net Profit Rate CHNR|AQMS - Net Margin|Sayona Mining - Company Net Profitability|AMLI (americanlithiumcorp.com) - Return on Sales by Net Profit|HAYN (Haynes International) - Net Margin|Net Margin Lithium Americas Corp|Return on Sales by Net Profit piedmontlithium.com (PLL)