Harvard Bioscience Inc. (HBIO): Market Capitalization-to-Revenue Ratio

Symbol and logo of brand Harvard Bioscience (HBIO)

Steady demand for laboratory equipment provides Harvard Bioscience (HBIO) with a consistent cash flow. The company leverages the Life Sciences B2B segment through well-known brands, utilizing contract assembly and global service outsourcing. The price-to-sales valuation clearly demonstrates the asset's current position, where the metric value is 0.50, allowing investors to determine the extent of the business premium.

Price-to-Revenue Ratio: Harvard Bioscience, Inc. (HBIO) for 07/04/2022 - 11/13/2026

Metric breakdowns and analytics for Harvard Bioscience (HBIO)
- stock quotes and analyst forecast:
Summary company analytics:Harvard Bioscience Inc.
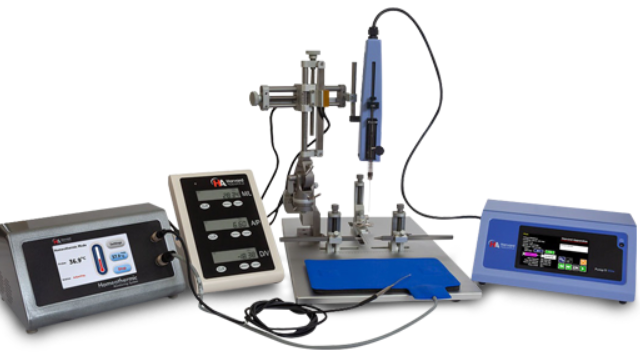
Mass-produced product of Harvard Bioscience Inc.

To minimize risks amid volatility, it is critical for investors to distinguish the intrinsic value of a business from market speculation. The P/S ratio relates market capitalization to annual sales volume, revealing whether an asset is overvalued or undervalued. By analyzing the average P/S of a company, one can determine how much the market is willing to pay for each unit of revenue. For Harvard Bioscience (HBIO), this metric reflects the investment attractiveness of their engineering developments in microfluidic chips and organ-on-a-chip systems.

Competitors of Harvard Bioscience

Market Cap to Sales Volume ISRG|Price-to-Revenue Ratio Danaher DHR|Market Capitalization-to-Revenue Ratio BDX|STE: Market Cap to Revenue|WST - P/S Multiple|Baxter International (BAX) - Price-to-Revenue Ratio|Market Cap to Revenue masimo.com|STVN (Stevanato Group) - P/S Multiple|Price to Sales Teleflex Inc. TFX|Price-to-Revenue Ratio Merit Medical Systems Inc (MMSI)|Nobel Biocare - Market Cap to Revenue Ratio|ICU Medical, Inc. - Market Cap to Revenue|Market Cap to Sales Volume XRAY (dentsplysirona.com)|LMAT - Price-to-Revenue Ratio|Price-to-Revenue Coefficient AtriCure Inc ATRC|STAA: P/S Multiple|Niagen - Market Capitalization-to-Revenue Ratio|ZIMV (ZimVie Inc.) - P/S Multiple|P/S Multiple angiodynamics.com|Price-to-Revenue Ratio Cerus (CERS)|TKNO (Alpha Teknova) - Market Capitalization-to-Revenue Ratio|Monogram Technologies Inc - Market Cap to Revenue|Sharps Technology Inc - Price-to-Revenue Ratio|InfuSystem Inc - P/S Multiple|UTMD - P/S Multiple|korumedical.com (KRMD) - Price-to-Revenue Ratio|Nyxoah SA - Market Capitalization-to-Revenue Ratio|MBOT (Microbot Medical Inc) - P/S Multiple|Market Cap to Revenue Ratio PDEX (Pro-Dex Inc.)|Market Cap to Revenue ZTEK (Zentek Ltd.)|ELUT (elutia.com) - Market Capitalization-to-Revenue Ratio|P/S Multiple MLSS (Milestone Scientific Inc.)|NEXGEL Inc. - Price-to-Revenue Ratio|Retractable Tech - P/S Multiple|Price-to-Revenue Coefficient Femasys Corporation FEMY|meihuamed.com (MHUA) - Price-to-Revenue Ratio|Price to Sales Predictive Oncology Inc. (POAI)|Price-to-Revenue Ratio Callan JMB Inc.|Atrion Corp. (ATRI) - Price-to-Revenue Coefficient|P/S Multiple NURO