Harvard Bioscience Inc. (HBIO) Price to Earnings Ratio

Harvard Bioscience - graphic logo of issuer HBIO

This daily price chart reflects that the value of Harvard Bioscience (HBIO) on the GURU.Markets platform is -3.90, which correlates with the firm's limited pricing power due to spending cuts by biotech startups. Harvard Bioscience generates revenue by supplying Life Sciences equipment to universities and pharmaceutical centers; however, the business faces dumping from Eastern competitors and the risk of reduced scientific subsidies.

Harvard Bioscience (HBIO) - P/E Multiple from 07/04/2022 to 11/10/2026

Analytical breakdowns for Harvard Bioscience
General company analysis:Harvard Bioscience Inc., HBIO
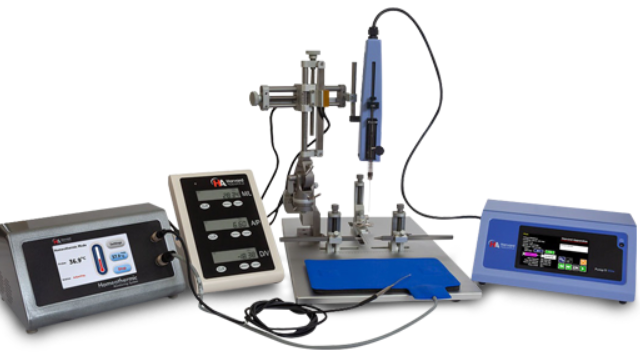
Product sample of Harvard Bioscience

The P/E ratio reflects the market value of a single share relative to the net profit per share, allowing an investor to assess the capital payback period through the lens of fundamental value. By analyzing the price-to-earnings dynamics, one can understand the extent to which the market is willing to pay a premium for the status of Harvard Bioscience (HBIO) as a benchmark manufacturer of precision equipment, whose quality is critical for the accuracy of global preclinical research.

Analysis of competing companies

P/E Multiple intuitive.com|Price to Earnings Ratio Danaher (DHR)|Price to Earnings Ratio BDX (BD)|STERIS Corporation - Price to Earnings Ratio|Company Value to Net Income WST|Baxter International - P/E Multiple|Business Payback Period masimo.com MASI|Stevanato Group (STVN) - Price to Earnings Ratio|Price to Earnings Multiple TFX|Price to Earnings Ratio Merit Medical Systems Inc|Nobel Biocare (NVST) - Business Payback Period|Price to Earnings Ratio ICUI (ICU Medical, Inc.)|Market Price to Net Income Ratio XRAY|Price to Earnings Ratio LeMaitre Vascular LMAT|Company Value to Net Income ATRC|STAA: Price to Earnings Ratio|NAGE - P/E Multiple|ZimVie Inc. (ZIMV) - Price to Earnings Ratio|Price to Earnings Ratio angiodynamics.com|CERS (Cerus) - P/E Multiple|Market Cap to Earnings Alpha Teknova TKNO|Price to Earnings Ratio Monogram Technologies Inc (MGRM)|sharpstechnology.com - Price to Earnings Multiple|InfuSystem Holdings, Inc. - Price to Earnings Ratio|Market Price to Net Income Ratio UTMD (utahmed.com)|KRMD - Price to Earnings Ratio|Business Payback Period Nyxoah SA NYXH|MBOT: P/E Multiple|Pro-Dex Inc. - Company Value to Net Income|ZTEK (Zentek Ltd.) - P/E Multiple|P/E Multiple elutia.com|Price to Earnings Ratio Milestone Scientific Inc. (MLSS)|NXGL (NEXGEL Inc.) - Company Value to Net Income|Retractable Technologies, Inc. - Price to Earnings Ratio|Femasys Corporation - Price to Earnings Ratio|Meihua Medical - P/E Multiple|POAI - P/E Multiple|callanjmb.com (CJMB) - Price to Earnings Ratio|Atrion Corp. - Company Value to Net Income|NURO (NeuroMetrix Corp) - P/E Multiple