Revenue Dynamics YoY (Last Twelve Months): Installed Building Products, Inc. (IBP)

Installed Building Products optimizes warehouse supply through an extensive network of branches. Year-over-year sales dynamics over the last 12 months TTM visualize this growth, while the 0.70 metric confirms the current level. Insulation installation helps clients implement ESG standards by reducing energy costs. The company's current course is based on the acquisition of regional players to strengthen its leadership in the finishing sector.

installedbuildingproducts.com (IBP) - metric breakdowns and financial figures
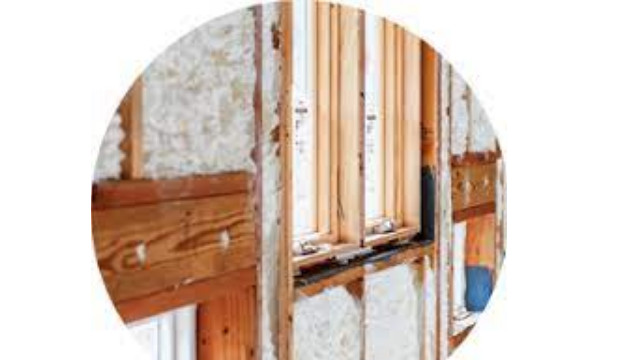
Installed Building Products (IBP) maintains a high dependency on mortgage rates and new construction volumes, rendering the business extremely sensitive to macroeconomic cycles. This relative revenue growth over four quarters compared to last year measures the company's expansion dynamics while neutralizing short-term seasonal fluctuations. The metric is calculated as the percentage change in total revenue over the last twelve months relative to the same period last year. A steady upward trend confirms management effectiveness amid a volatile housing market.
