Ionis Pharma (IONS): Market Capitalization-to-Revenue Ratio

Symbol and logo of brand Ionis Pharmaceuticals, Inc. (IONS)

Ionis Pharmaceuticals (IONS) relies on its own R&D centers while utilizing the capacity of contract manufacturing plants. Revenues are generated through royalties and licensing agreements with pharmaceutical behemoths. High-margin RNA therapy effectively blocks the synthesis of harmful proteins in genetic pathologies. The current status is 4.70, which is clearly demonstrated by the price-to-sales ratio chart.

IONS Ionis Pharmaceuticals: P/S Multiple in the range 07/04/2022 - 11/13/2026

Analytical breakdowns for Ionis Pharma (IONS)
- stock value and consensus price forecast:
- stock exchange capitalization data:
Summary company analytics:IONS ionispharma.com
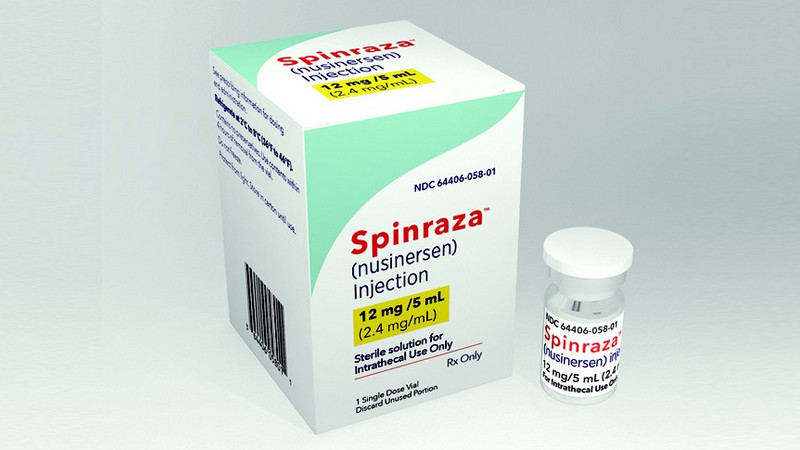
Original product of Ionis

For Ionis Pharmaceuticals (IONS), whose business is based on scalable RNA therapeutics, this indicator reflects market expectations for the future monetization of patented developments relative to current revenues. By analyzing the price-to-sales ratio on the GURU.Markets platform, an investor assesses the extent of the premium paid for growth potential, comparing market capitalization with actual revenue to identify the gap between the speculative price and fundamental cash flows.

Who Ionis Pharmaceuticals competes with

P/S Multiple Tempus AI (TEM)|Price-to-Revenue Ratio Qiagen QGEN|Market Capitalization-to-Revenue Ratio RGEN|RNA - Price-to-Revenue Ratio|CRISPR (CRSP) - Market Cap to Revenue|WGS: P/S Multiple|ultragenyx.com (RARE) - P/S Multiple|BEAM (Beam Therapeutics) - P/S Multiple|Market Cap to Revenue Sarepta Therapeutics (SRPT)|P/S Multiple TWST|TXG - Price to Sales|Intellia Therapeutics - Market Cap to Revenue|P/S Multiple stoketherapeutics.com STOK|BLFS: Market Cap to Revenue|Wave Life Sciences Ltd - Market Cap to Sales Volume|MAZE: P/S Multiple|SION - Price-to-Revenue Coefficient|PRME (Prime Medicine, Inc.) - P/S Multiple|Market Cap to Revenue tayshagtx.com (TSHA)|P/S Multiple QURE|P/S Multiple MeiraGTx Holdings (MGTX)|Price-to-Revenue Ratio Regenxbio RGNX|Solid Corp - Price-to-Revenue Ratio|OCGN - Price-to-Revenue Ratio|Price-to-Revenue Coefficient pacb.com PACB|BNTC: P/S Multiple|DSGN - Price-to-Revenue Coefficient|Price-to-Revenue Ratio Rocket Pharmaceuticals Inc|Price to Sales 4D Molecular Corp FDMT|Price-to-Revenue Ratio Lexeo Therapeutics (LXEO)|korrobio.com - Market Cap to Revenue Ratio|Price-to-Revenue Ratio Editas Medicine EDIT|Price-to-Revenue Coefficient Silence Therapeutics PLC (SLN)|ProQR Therapeutics NV - P/S Multiple|CDXS (Codexis, Inc.) - Market Cap to Revenue Ratio|Sangamo Therapeutics (SGMO) - Price-to-Revenue Ratio|Market Cap to Revenue Ratio NAUT|MGX (Metagenomi) - P/S Multiple|P/S Multiple precisionbiosciences.com|P/S Multiple GBIO|Price-to-Revenue Coefficient Boundless Bio Inc|Price-to-Revenue Ratio Exicure XCUR|Imunon Inc (IMNN) - Price to Sales|PHIO - Price-to-Revenue Ratio|MBIO (Mustang Bio, Inc.) - Market Cap to Revenue Ratio|RNAZ: P/S Multiple|BNGO - Price-to-Revenue Coefficient|Price-to-Revenue Ratio Applied DNA Sciences|bluebirdbio.com (BLUE) - Price-to-Revenue Coefficient|Market Cap to Revenue IPA (ImmunoPrecise Antibodies)|OMGA (Omega Therapeutics Inc) - Market Capitalization-to-Revenue Ratio|Price-to-Revenue Ratio Singular Genomics Systems Inc OMIC|RGLS (Regulus) - Price-to-Sales Ratio|Syros Pharmaceuticals - P/S Multiple|Market Capitalization-to-Revenue Ratio TBIO (telesisbio.com)|TCON: P/S Multiple|Unity Biotechnology Inc. (UBX) - P/S Multiple