Omega Therapeutics Inc (OMGA): Market Capitalization-to-Revenue Ratio

Symbol and logo of brand Omega Therapeutics Corp (OMGA)

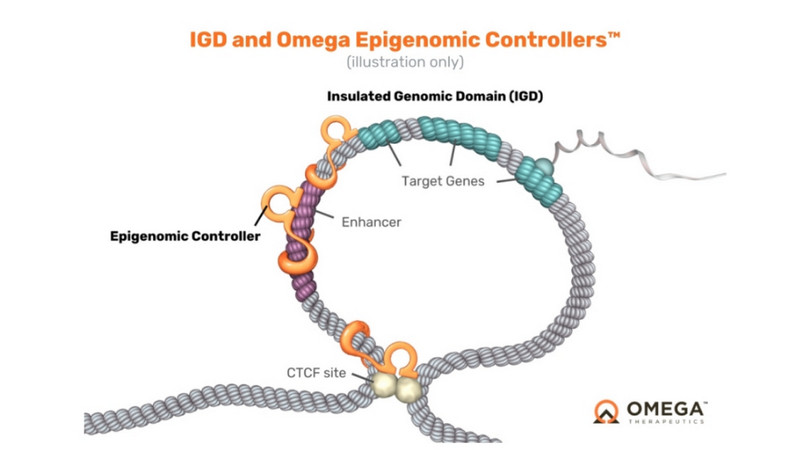
Omega Therapeutics is implementing a breakthrough platform for the precise tuning of gene expression without damaging DNA. The price-to-sales ratio dynamics correlate with these innovations, where 0.90 describes the current status of the metric. Risks are linked to fierce patent battles within the biotech sector; however, a stable staff of elite bioinformaticians and support from major partners provide the company with a sustainable technological advantage.

Price-to-Revenue Ratio: Omega Therapeutics Corp (OMGA) for 07/04/2022 - 03/08/2025

Omega (OMGA) - metric breakdowns and financial figures
- current quotes and average value forecast:
- stock exchange capitalization data:
Summary company analytics:omegatherapeutics.com
Mass-produced product of Omega

Investors are assessing the resilience of Omega Therapeutics (OMGA) through the market capitalization-to-revenue ratio, which determines the valuation of each dollar of sales. By analyzing the fundamental P/S ratio, market expectations for the epigenomic platform can be compared with current revenues, accounting for the high risks associated with early-stage Pipeline assets and the mitigating influence of a partnership with a pharma behemoth.

Competing companies

TEM - Price to Sales|Price-to-Revenue Ratio Qiagen QGEN|Market Capitalization-to-Revenue Ratio IONS|Repligen Corp. - P/S Multiple|RNA - P/S Multiple|CRISPR Therapeutics AG (CRSP) - Price-to-Revenue Ratio|Price-to-Sales Ratio WGS (genedx.com)|RARE (Ultragenyx) - P/S Multiple|Price to Sales Beam Therapeutics Inc BEAM|Market Cap to Revenue SRPT (Sarepta Therapeutics Inc)|P/S Multiple Twist Bioscience Corp (TWST)|10x Genomics, Inc. - Market Cap to Revenue|Market Cap to Sales Volume NTLA (intelliatx.com)|Stoke Therapeutics, Inc. - P/S Multiple|Price-to-Revenue Coefficient BioLife Solutions Inc BLFS|WVE: P/S Multiple|Market Cap to Revenue Maze Therapeutics Corp|Price-to-Revenue Ratio Sionna Therapeutics Inc|primemedicine.com (PRME) - Price-to-Revenue Coefficient|Price-to-Revenue Ratio Taysha Gene Therapies, Inc. (TSHA)|QURE - Price to Sales|Price-to-Revenue Ratio MeiraGTx PLC MGTX|RGNX - Market Cap to Revenue|Solid Biosciences Inc. - P/S Multiple|Price-to-Revenue Multiple ocugen.com (OCGN)|PACB: P/S Multiple|Benitec Biopharma Inc (BNTC) - P/S Multiple|DSGN (Design Pharma) - P/S Multiple|Market Cap to Revenue Ratio RCKT (Rocket Corp)|Price-to-Revenue Ratio 4D Molecular Therapeutics (FDMT)|lexeotx.com - Market Cap to Revenue Ratio|P/S Multiple KRRO (Korro Bio)|P/S Multiple Editas Medicine Inc EDIT|SLN - Price-to-Revenue Ratio|Price to Sales ProQR Therapeutics N.V.|codexis.com (CDXS) - Price-to-Revenue Ratio|Market Cap to Revenue sangamo.com|NAUT (Nautilus Biotechnology, Inc.) - P/S Multiple|Price to Sales Metagenomi Inc. MGX|P/S Multiple DTIL|generationbio.com (GBIO) - Price-to-Revenue Multiple|P/S Multiple BOLD (Boundless Bio, Inc.)|P/S Multiple Exicure Inc. XCUR|IMNN: Market Cap to Revenue|Market Capitalization-to-Revenue Ratio PHIO (Phio Pharmaceuticals)|MBIO (mustangbio.com) - Market Cap to Revenue|RNAZ: Market Cap to Sales Volume|BNGO (Bionano Genomics Inc.) - P/S Multiple|APDN: Market Capitalization-to-Revenue Ratio|P/S Multiple BLUE|IPA - Price to Sales|Price-to-Revenue Ratio Singular Genomics Systems Inc OMIC|Market Capitalization-to-Revenue Ratio RGLS|Syros Pharmaceuticals - P/S Multiple|TBIO - P/S Multiple|TRACON Pharmaceuticals, Inc. (TCON) - Price-to-Revenue Ratio|Price-to-Sales Ratio UBX (Unity Biotechnology Inc.)