JACK (Jack in the Box Corp) Operating Margin
JACK (Jack in the Box Restaurants) - company brandmark

Jack in the Box Inc. (JACK) is diversifying its revenue streams through the development of two brands and franchising. An assessment of operating profitability confirms this approach, where 15.10 shows the level of this metric. Business efficiency is supported by a presence in the Southern and Western US states. Meanwhile, the royalty model provides excess liquidity, allowing the company to easily service its obligations and pay dividends.

JACK: Jack in the Box Operating Sales Margin 07/04/2022 - 11/20/2026

Jack in the Box Inc. - analytical breakdowns and key metrics (JACK)
- price and consensus price forecast:
Initial company analysis:JACK, Jack in the Box Inc.
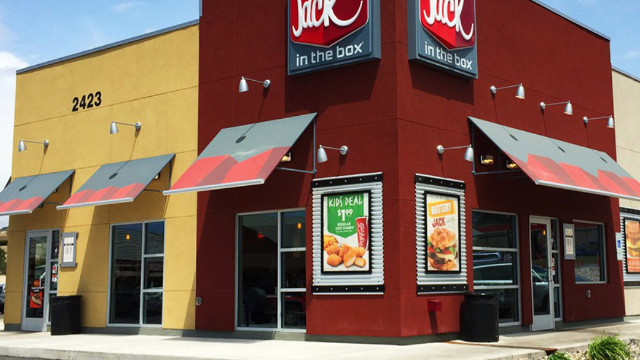
Brand item of Jack in the Box Restaurants

Network modernization and the transition to a lightweight franchising model directly impact the current efficiency of Jack in the Box Inc. (JACK). The trend in average operating margin illustrates the business's ability to generate profit before interest and taxes. This metric measures the share of operating income in revenue, reflecting the internal profitability of core processes. It is critical for investors to monitor the stability of this ratio amid sales fluctuations. The consistency of this indicator confirms the success of management's strategy.

Competing companies

MCD (McDonald's Corp) - Operating Margin|Starbucks Corporation (SBUX) - Profitability of Operations|Operating Margin CMG|Operating Sales Margin Yum! Brands YUM|Operating Margin SYY (Sysco Corp)|Operating Profitability Margin Burger King|darden.com - Operating Margin|Profitability of Operations Toast, Inc. TOST|US Foods (USFD) - Operating Profitability|Operating Sales Margin Yum China Holdings|Operating Profitability Domino's Pizza|TXRH: Operating Profit Rate|Operating Profitability Aramark Corp (ARMK)|Operating Profitability BROS (Dutch Bros Corp)|Operating Profitability CAVA Group CAVA|WING (Wingstop) - Operating Profit Margin|MIDD - Operating Profitability|EAT (Maggiano's) - Return on Sales by Operating Profit|SHAK: Operating Margin|Operating Return on Sales The Cheesecake Factory Inc. (CAKE)|WEN (wendys.com) - Operating Margin|Olo - Operating Profit Margin|Operating Margin PZZA|ARCO - Operating Return on Sales|Operating Profitability br.coffee BRCB|Operating Profit Rate HDL|CBRL - Operating Profitability|Profitability of Operations Sweetgreen, Inc. SG|First Watch Inc (FWRG) - Operating Profitability|Biglari Holdings - Operating Profit Rate|KRUS (Kura Sushi Corp) - Operating Margin|Operating Profitability PLAY|Operating Margin BJRI|Bloomin' Brands, Inc. - Return on Sales by Operating Profit|Operating Margin DNUT (Krispy Kreme Inc)|Profitability of Operations Potbelly Sandwich Shop (PBPB)|KRT: Operating Sales Margin|Operating Profit Margin PTLO|Dine Brands (DIN) - Operating Profitability|Return on Sales by Operating Profit LOCO|Operating Profitability Denny's Corp.|Operating Margin twinpeaksrestaurant.com|Operating Margin MB|Red Robin (RRGB) - Operating Profitability Margin|Operating Profitability GEN Restaurant Group, Inc. GENK|Profitability of Operations The ONE Group (STKS)|BDL - Operating Profitability|Profitability of Operations Rave Restaurant Group RAVE|FAT: Operating Margin|Giftify, Inc. (GIFT) - Operating Margin|NDLS (noodles.com) - Operating Margin|Ark Restaurants - Operating Profit Margin|Operating Profitability Vestand Inc. (VSTD)|LBGJ (Li Bang International) - Operating Profit Rate|Operating Profitability HWH Corp HWH|Operating Margin Good Times Burgers GTIM|PC - Operating Profitability|Operating Return on Sales itsburgertime.com|HCHL: Operating Margin|Operating Sales Margin BurgerFi International Inc.|CHUY (Chuy's Restaurants) - Operating Margin|Operating Profitability ONDR|Operating Margin PNST|Operating Sales Margin Presto PRST|Operating Margin YOSH (Yoshiharu Global Co)|Profitability of Operations Twin Hospitality Group Inc. (TWNPV)