JACK: Jack in the Box Corp Price-to-Revenue Coefficient
Corporate company logo of Jack in the Box Inc (JACK)

Jack in the Box Inc. (JACK) maintains its price-to-sales ratio dynamics through a stable presence in the Southern and Western regions of the US via franchising. The implementation of ESG environmental standards and oil recycling strengthen the foundation, while the digitalization of sales helps counter pricing pressure from competitors. The current level of 0.20 reflects the magnitude of this metric, demonstrating the market valuation of the business relative to its annual revenues.

JACK (Jack in the Box Inc.) P/S Multiple history from 07/04/2022 to 11/13/2026

Analytical breakdowns for Jack in the Box Corp (JACK)
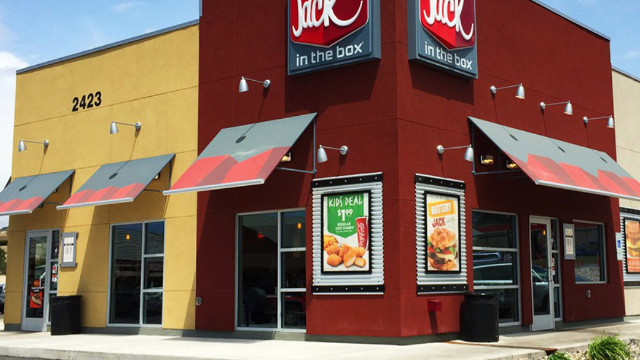
General company analysis:JACK (jackintheboxinc.com)
Brand item of Jack in the Box Corp

The P/S ratio determines the market value of Jack in the Box Inc. (JACK) relative to its annual revenue, allowing for an assessment of the value of each unit of the business's sales. The price/sales trend separates market noise from fundamental stability, demonstrating how effectively the recognizable brand and franchising model with a unique menu transform operational flows into the company's capitalization.

Competitors of Jack in the Box Inc.

MCD (corporate.mcdonalds.com) - Market Capitalization-to-Revenue Ratio|P/S Multiple SBUX (Starbucks)|Price-to-Revenue Coefficient Chipotle Mexican Grill, Inc. (CMG)|YUM - Price-to-Revenue Ratio|SYY (Sysco Corp.) - Market Cap to Revenue Ratio|QSR: P/S Multiple|Price-to-Revenue Multiple darden.com DRI|Price-to-Revenue Ratio Toast|USFD (US Foods, Inc.) - Market Cap to Sales Volume|P/S Multiple YUMC|P/S Multiple Domino's Pizza Corp (DPZ)|P/S Multiple TXRH (Texas Roadhouse, Inc.)|ARMK - Market Cap to Revenue|BROS - Price-to-Revenue Ratio|CAVA - P/S Multiple|WING (Wingstop Inc) - Market Cap to Revenue|Middleby Marshall - Market Capitalization-to-Revenue Ratio|EAT (Brinker International) - P/S Multiple|shakeshack.com (SHAK) - Price-to-Revenue Coefficient|Price-to-Revenue Ratio The Cheesecake Factory Incorporated (CAKE)|Wendy's Company - Market Cap to Revenue Ratio|Olo Platform - Market Cap to Revenue|Market Capitalization-to-Revenue Ratio PZZA|ARCO: Market Cap to Revenue|br.coffee - Market Cap to Sales Volume|HDL: P/S Multiple|Cracker Barrel Old Country Store, Inc. - Market Capitalization-to-Revenue Ratio|SG (Sweetgreen Corp) - P/S Multiple|Price to Sales First Watch Restaurant Group, Inc. FWRG|Market Cap to Revenue BH (Biglari Holdings Inc.)|KRUS (kurasushi.com) - Market Capitalization-to-Revenue Ratio|P/S Multiple PLAY (Dave & Buster's Entertainment)|BJ's Restaurants Inc - Price-to-Revenue Ratio|BLMN - Price-to-Revenue Ratio|Price to Sales Krispy Kreme Corp|PBPB (Potbelly Corporation) - Market Cap to Revenue|Market Cap to Revenue Ratio KRT|Market Cap to Revenue PTLO|DIN: Market Capitalization-to-Revenue Ratio|P/S Multiple LOCO|Price-to-Revenue Coefficient Denny's Diner|Price-to-Revenue Ratio Twin Hospitality Group TWNP|MB: Market Cap to Revenue Ratio|Red Robin Gourmet Burgers Inc. - P/S Multiple|GEN Restaurant Group Inc (GENK) - Market Cap to Revenue|STKS (The ONE Group Hospitality Inc.) - Market Cap to Revenue|BDL - Price-to-Revenue Coefficient|Price-to-Revenue Ratio raverg.com|FAT (Fatburger) - Market Cap to Sales Volume|P/S Multiple GIFT|P/S Multiple Noodles & Co (NDLS)|P/S Multiple ARKR (Ark Restaurants)|VSTD - Market Cap to Revenue|LBGJ - Price-to-Revenue Ratio|HWH - P/S Multiple|Good Times Restaurants Inc. (GTIM) - Price-to-Revenue Ratio|Price-to-Sales Ratio PC (Premium Catering Holdings)|Market Cap to Revenue BTBD|P/S Multiple Happy City|P/S Multiple BFI|Price-to-Revenue Ratio CHUY (chuys.com)|Price-to-Revenue Ratio Sushi Ginza Onodera ONDR|Pinstripes Holdings, Inc. - Price-to-Revenue Ratio|Presto Automation Inc - P/S Multiple|Price-to-Revenue Coefficient Yoshiharu Global Co. YOSH|TWNPV: P/S Multiple