T. Marzetti - LANC Revenue Dynamics YoY (Last Twelve Months)

Lancaster Colony is implementing robotic packaging lines to eliminate errors while relying on the dedication of experienced technologists. The annual sales growth rate over a 12-month period reflects revenue dynamics where 6.10 represents the latest level. Conservative management with strict discipline ensures consistently high business margins, confirming shareholder confidence.

Lancaster Colony Corp. (LANC) - metric breakdowns and financial figures
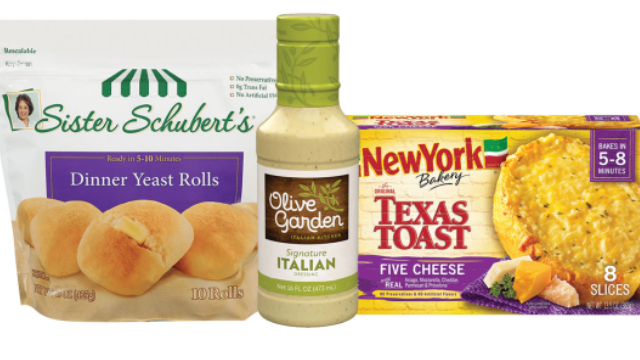
For Lancaster Colony (LANC), which possesses significant pricing power in the HoReCa sector, revenue dynamics confirm the effectiveness of the expansion of premium sauce and semi-finished product brands. Analyzing this 12-month YoY sales chart, an investor assesses the growth rates of cash flows over a rolling year, which, in the absence of debt, guarantees high business predictability and minimizes cost risks.
