Lancaster Colony Corp. (LANC) - Business Payback Period

Lancaster Colony Corp - graphic logo of issuer LANC

This daily price chart for Lancaster Colony (LANC) reflects the 27.70 indicator. The business relies on steady demand for frozen baked goods and sauces, which ensures a stable cash flow. Retail supply chain efficiency is supported by an advanced system of refrigerated transport and warehouses. High productivity is achieved through the implementation of robotic packaging systems that eliminate personnel errors.

Lancaster Colony Corporation - LANC P/E Multiple (period 07/04/2022 - 07/01/2025)

Comprehensive metric breakdowns and analytics for Lancaster Colony Corp. (LANC)
Summary company analysis:LANC (lancastercolony.com)
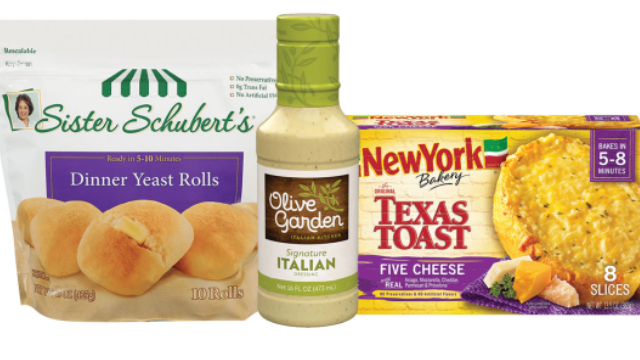
Manufactured product of T. Marzetti

This metric is calculated by dividing the market price per share by earnings per share, reflecting price sensitivity to actual financial results. This ratio separates fundamental value from speculative expectations, identifying asset overvaluation. For Lancaster Colony (LANC), given its debt-free status and strategy of acquiring premium brands, the metric confirms the effectiveness of organic growth. Analyzing the company's median P/E allows for the identification of the point where value drivers are exhausted. A decline in this value signals a risk of correction or an inflated bubble.

Key competitors

kraftheinzcompany.com - Market Cap to Net Income|P/E Multiple K|Business Payback Period General Mills Inc|Price to Earnings Ratio McCormick & Co. MKC|JBS: Price to Earnings Multiple|Hormel Foods Corporation - P/E Multiple|Business Payback Period jmsmucker.com SJM|Pilgrim's Pride Corporation (PPC) - Price to Earnings Ratio|CPB - Business Payback Period|SFD (Smithfield Foods, Inc.) - P/E Multiple|INGR: Company Value to Net Income|P/E Multiple LW|BRFS - Market Cap to Earnings|P/E Multiple POST (Post Holdings)|MZTI: Price to Earnings Multiple|BRBR: Price to Earnings Ratio|Company Value to Net Income TR (Tootsie Roll Corp)|FLO: P/E Multiple|Market Cap to Net Income SMPL (Simply Good Foods)|Price to Earnings Ratio Nomad Foods|Market Cap to Earnings WK Kellogg Corporation KLG|Price to Earnings Ratio J&J Snack Foods Corp. (JJSF)|UTZ - Market Cap to Earnings|P/E Multiple THS (TreeHouse Foods, Inc.)|STKL: Price to Earnings Multiple|JBSS - Price to Earnings Ratio|SENEA: Price to Earnings Ratio|LWAY: P/E Multiple|Mama's Creations Corp (MAMA) - P/E Multiple|Price to Earnings Ratio B&G Foods, Inc.|Price to Earnings Multiple BYND (Beyond Burger)|P/E Multiple HAIN|Price to Earnings Ratio Bridgford Foods Corp. BRID|P/E Multiple WYHG (Wing Yip Food Holdings)|P/E Multiple lairdsuperfood.com LSF|BRLS - Price to Earnings Ratio|Business Payback Period Farmer Bros. Co. FARM|BOF (branchoutfood.com) - Price to Earnings Ratio|PFAI: Market Price to Net Income Ratio|SOWG (Sow Good Inc) - P/E Multiple|Market Cap to Earnings Top Wealth Group Ltd TWG|Price to Earnings Ratio Steakholder Foods Ltd. (STKH)|BSFC (bluestarfoods.com) - Company Value to Net Income|Whole Earth Brands, Inc. - Price to Earnings Ratio|Company Value to Net Income RGF|Stryve - P/E Multiple|Sovos Brands Corp (SOVO) - Price to Earnings Ratio