LYTS LSI Industries Inc. Enterprise Value to EBITDA Ratio

Official company branding of LSI Industries (LYTS)

LSI Industries Inc. (LYTS) relies on retail and gas station investments in LED systems. This EV/EBITDA chart visualizes the impact of these cycles and aluminum costs, where 11.89 shapes the current metric. Revenue is based on the sale of lighting, signage, and ancillary installation services. Full plant capacity is maintained through workshop modernization to eliminate downtime.

LSI Corp - LYTS Total Company Value to Operating Income Before Depreciation Ratio (period 11/23/2025 - 11/14/2026)

Summary analytical data breakdowns for lsicorp.com (LYTS)
- market price and analyst price targets:
Initial company analysis:LYTS (LSI Corp)
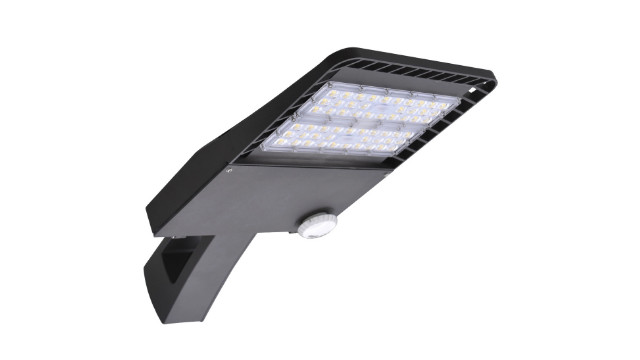
Original product of lsicorp.com

The EV/EBITDA multiple compares the total enterprise value, including net debt, with operating profit to determine the real value of assets relative to generated cash flow. By analyzing the historical EV/EBITDA trajectory, an investor assesses the efficiency of the capital-intensive model of LSI Industries Inc. (LYTS), where high entry costs are driven by strict adherence to international building codes and mandatory certification of lighting systems.

Competitor analysis for LSI Industries Inc.

Enterprise Value to Earnings Before Interest, Taxes, Depreciation and Amortization Trane Technologies Inc. TT|Enterprise Value to EBITDA Multiple JCI plc|CARR: Enterprise Value to EBITDA Ratio|XYL - EV/EBITDA Multiple|VLTO: EV/EBITDA Multiple|HUBB - Total Company Value to Operating Income Before Depreciation Ratio|Enterprise Value to Earnings Before Interest, Taxes, Depreciation and Amortization Lennox Industries|Pentair Ltd. - Company Value to Operating Income Before Depreciation Ratio|Enterprise Value to Earnings Before Interest, Taxes, Depreciation and Amortization nVent Electric plc (NVT)|Enterprise Value to EBITDA Ratio acuitybrands.com AYI|EV/EBITDA Multiple AOS (A. O. Smith)|Watts (WTS) - Company Value to EBITDA|ZWS - Enterprise Value to Earnings Before Interest, Taxes, Depreciation and Amortization|FBIN (Fortune Brands Corp) - Enterprise Value to Operating Income Before Depreciation|AAON (aaon.com) - Enterprise Value to EBITDA Ratio|ITRI: Enterprise Value to Operating Income Before Depreciation Ratio|Enterprise Value to Earnings Before Interest, Taxes, Depreciation and Amortization Badger Meter|Enterprise Value to Earnings Before Interest, Taxes, Depreciation and Amortization FELE|Enterprise Value to Earnings Before Interest, Taxes, Depreciation and Amortization Mueller Co. (MWA)|Total Company Value to Operating Income Before Depreciation Ratio Powell Corp|EV/EBITDA Multiple PLPC (Preformed Line Products)|Total Company Value to Operating Income Before Depreciation Ratio energyrecovery.com (ERII)|OFLX: Enterprise Value to EBITDA Ratio|Business Value to Operating Income Before Depreciation PPIH (Perma-Pipe International Holdings, Inc.)|NEPH: EV/EBITDA Multiple|ZONE - Total Company Value to Operating Income Before Depreciation Ratio|Enterprise Value to Earnings Before Interest, Taxes, Depreciation and Amortization Orion Energy Systems Inc.|Enterprise Value to Operating Income Before Depreciation LIQT (liqtech.com)|EV/EBITDA Multiple WFF