LYTS lsicorp.com: Price-to-Projected Revenue Ratio

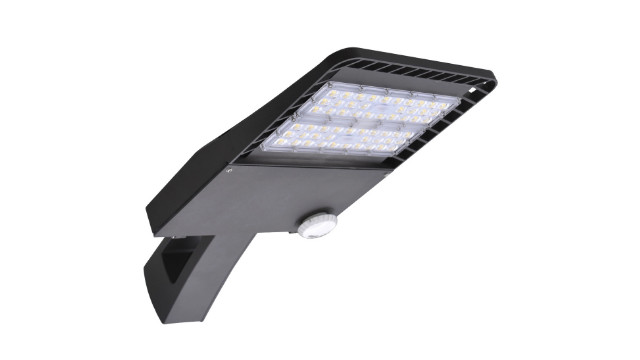
LSI Industries Inc. (LYTS) relies on complex B2B contracts for equipping stadiums and gas stations, while the implementation of IoT energy management systems drives its growth. The forward P/S indicator on the GURU.Markets chart demonstrates historical dynamics, where 0.30 describes the current status of the metric. Market capitalization is supported by the creation of energy-efficient LED matrices with sensors designed to optimize expenses for commercial properties.

Analytical breakdowns for LSI Industries Inc.
To identify fundamental sector leaders, the analyst evaluates the company's market capitalization relative to its projected sales. The forward P/S measures the sensitivity of expected revenue to borrowing costs, signaling the risk of overpayment when the multiple is inflated. For LSI Industries Inc. (LYTS), this metric reflects the dependence of B2B orders for lighting and displays on the credit burden of its clients. The trend in expected P/S allows for the real-time tracking of business valuation compression during periods of monetary policy tightening.
