MasterBeef - MB EV/Sales Multiple

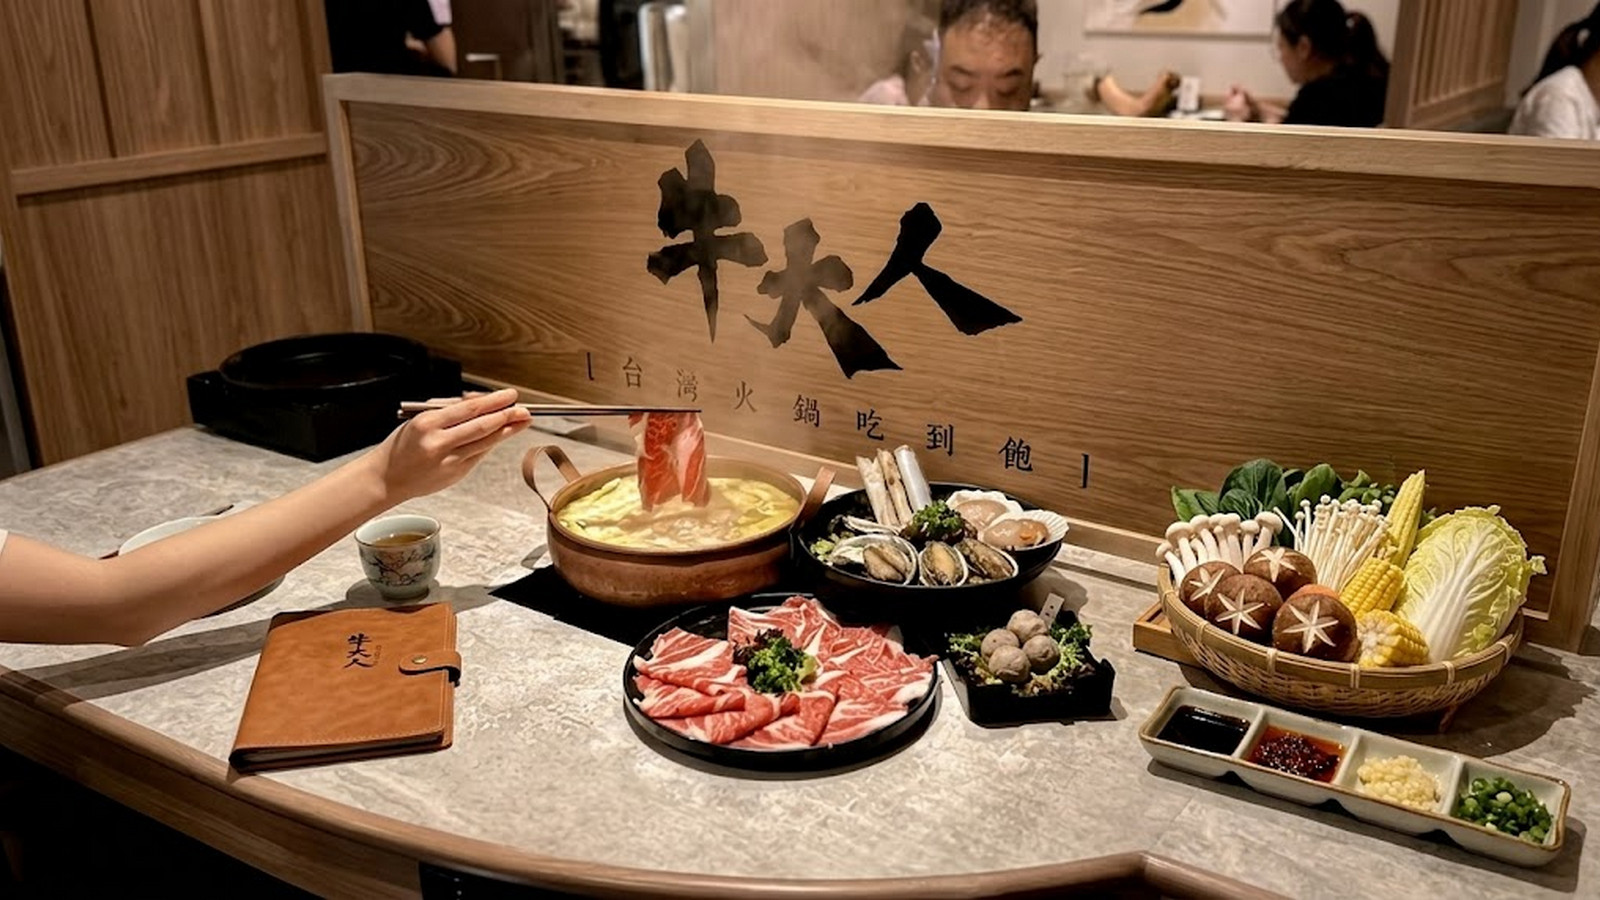
MasterBeef Group management relies on strict founder control coupled with local margin transparency. This EV/Revenue chart visualizes these characteristics, where the indicator reaches 1245.37. The financial results of the hot-pot chain are heavily dependent on seasonality and consumer demand, while technological development has stalled, limited to the implementation of standard ordering software.

MB (MasterBeef Group Ltd): analytical breakdowns and indicator data
Investors assess fundamental capital risks by analyzing business resilience to external shocks. For MasterBeef Group (MB), high competitor density in Asia and raw material price volatility are critical factors. The company's enterprise value-to-revenue trend reflects the dependence of capitalization on operating income, accounting for the debt load. An increase in this indicator signals overvaluation, while a decrease suggests a loss of efficiency. This allows for the timely identification of imbalances in the capital structure.
