ME 23andMe Holding Co: Net earnings per share for the last 12 months

Public company logo of 23andMe Inc. (ME)

23andMe Holding Co. (ME) is transforming its business, pivoting from stagnant testing toward drug discovery. The 12-month YoY change in net income per share reflects profitability dynamics, with the current level standing at -56.70. Revenue stability remains moderate as the subscription monetization model evolves. Simultaneously, 23andMe Holding Co. (ME) is implementing ESG standards by utilizing biodegradable packaging and protecting the privacy of genetic data.

ME 23andMe Holding Co Earnings per share for the last twelve months (02/11/2024 - 02/20/2024)

ME (23andme.com): analytical breakdowns and indicator data
- market price and analyst price targets:
- company stock capitalization data:
Fundamental company valuation:ME, 23andMe Inc.
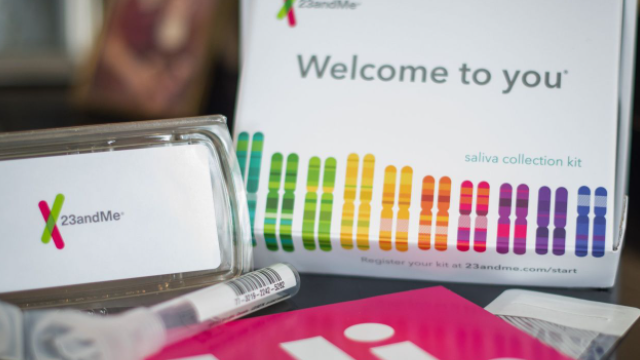
Finished products of 23andMe Holding Co.

Minimizing fundamental risks requires selecting assets with sustainable profit dynamics. This indicator measures the annual change in net profit per share over a twelve-month rolling period, excluding quarterly lags. For 23andMe Holding Co. (ME), this metric reflects the monetization efficiency of genetic data and subscription services. By analyzing the 12-month YoY EPS growth chart on GURU.Markets, an investor can discern the actual speed of business scaling. A declining curve signals rising operating expenses.

Direct competitors

A - Net earnings per share (EPS TTM)|Quest Corp (DGX) - Earnings per share for the last twelve months|ILMN - Net earnings per share for the last four quarters|Earnings per share for the last twelve months exactsciences.com|revvity.com (RVTY) - Net earnings per share for the last four quarters|Net earnings per share (EPS TTM) BIO|Net earnings per share (EPS TTM) Anbio Biotechnology Ltd (NNNN)|Sotera Health - Net earnings per share for the last 12 months|Net earnings per share (EPS TTM) QuidelOrtho Corp QDEL|OPK - Earnings per share for the last twelve months|Earnings per share for the trailing year CDNA (caredx.com)|MRVI: Net earnings per share (EPS TTM)|Net earnings per share for the trailing year Fulgent Genetics FLGT|LAB (Standard BioTools Inc) - Net earnings per share (EPS TTM)|Net earnings per share (EPS TTM) Cytek Biosciences, Inc.|Earnings per share for the last twelve months OraSure Technologies (OSUR)|XGN (Exagen) - Earnings per share for the trailing year|Earnings per share for the last twelve months MDxHealth MDXH|LUCD: Earnings per share for the last 12 months|PRE - Earnings per share for the last twelve months|Earnings per share for the trailing year IMDX (Insight Molecular Diagnostics Inc)|TRIB: Net earnings per share (EPS TTM)|prophaselabs.com - Earnings per share for the trailing year|Net earnings per share for the last 12 months AIMD|Co-Diagnostics Corp (CODX) - Net earnings per share for the last four quarters|Net earnings per share for the last 12 months HSCS (Heart Test Laboratories Inc.)|Net earnings per share for the last four quarters Biomerica Inc|Earnings per share for the last twelve months cardiodiagnosticsinc.com CDIO|ONCO: Earnings per share for the last 12 months|VRAX - Earnings per share for the last twelve months|BJDX (Bluejay Diagnostics Inc) - Earnings per share for the last 12 months|AWH: Net earnings per share (EPS TTM)|Accelerate Diagnostics, Inc (AXDX) - Net earnings per share (EPS TTM)|CNTG (CENTOGENE, N.V.) - Net earnings per share (EPS TTM)|Net earnings per share for the last 12 months Enzo Biochem (ENZ)|Net earnings per share for the last 12 months FRES (fresh2.co)|GENE - Net earnings per one share for the last twelve months|Net earnings per share (EPS TTM) PMD (Psychemedics)