23andMe Holding Co (ME) Business Payback Period

23andMe Holding Co - graphic logo of issuer ME

23andMe Holding Co. (ME) has lost its pricing power over consumer services, although it maintains its position in biotechnology. The business is currently undergoing a deep crisis due to its dependence on DNA tests and therapy costs, necessitating an asset review. This price chart on GURU.Markets shows a value of 0.00, while the company actively collaborates with pharma behemoths, providing access to genetic datasets for the development of new medications.

23andMe (ME) Price to Earnings Ratio: for the period 07/04/2022 - 04/05/2025

Comprehensive metric breakdowns and analytics for 23andMe Inc (ME)
- market price and analyst price targets:
Comprehensive company analysis:23andMe ME
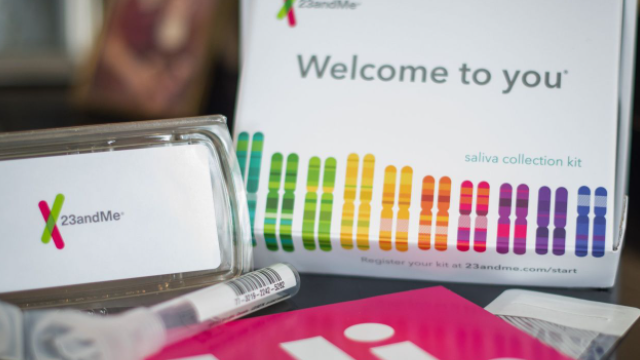
Signature product of 23andMe Inc.

Comparative asset analysis requires a precise determination of the value of each unit of profit. The multiple correlates market capitalization with net income, measuring the investment payback period. For 23andMe Holding Co. (ME), this calculation is complicated by the transition from selling tests to developing drugs based on a massive DNA dataset. The current value of 0.00 reflects market expectations for this transformation. By analyzing the company's median P/E, an investor can distinguish fundamental growth from speculative overheating.

Key competitors

Agilent (A) - Business Payback Period|Price to Earnings Ratio DGX (questdiagnostics.com)|Price to Earnings Ratio ILMN (Illumina, Inc.)|Exact Sciences Corp - Price to Earnings Ratio|revvity.com (RVTY) - Market Cap to Earnings|Bio-Rad Laboratories, Inc. - P/E Multiple|Business Payback Period Anbio NNNN|Nordion (SHC) - Price to Earnings Ratio|QDEL - Business Payback Period|Price to Earnings Ratio OPKO Health Inc|CareDx (CDNA) - Business Payback Period|Price to Earnings Ratio Maravai LifeSciences Holdings (MRVI)|FLGT: Market Cap to Net Income|P/E Multiple LAB (Standard BioTools Inc)|Cytek Biosciences, Inc. (CTKB) - Market Cap to Earnings|OraSure Corp - P/E Multiple|Market Cap to Net Income Ratio exagen.com (XGN)|MDXH: P/E Multiple|LUCD - Business Payback Period|Price to Earnings Ratio PRE|IMDX - Market Cap to Net Income Ratio|Price to Earnings Ratio TRIB (Trinity Biotech plc)|P/E Multiple prophaselabs.com (PRPH)|P/E Multiple AIMD (Ainos Inc)|Market Cap to Net Income Ratio Co-Diagnostics Inc|heartsciences.com - P/E Multiple|Biomerica, Inc (BMRA) - Price to Earnings Ratio|CDIO: P/E Multiple|Price to Earnings Multiple ONCO|Price to Earnings Ratio Virax Biolabs|Bluejay Diagnostics, Inc. (BJDX) - Business Payback Period|Price to Earnings Ratio Aspira Women's Health (AWH)|AXDX (Accelerate Diagnostics, Inc) - Company Value to Net Income|CENTOGENE, N.V. - Price to Earnings Ratio|Company Value to Net Income ENZ|Company Value to Net Income fresh2.co (FRES)|GENE (Genetic Technologies Limited) - Price to Earnings Multiple|PMD: P/E Multiple