MGY - Magnolia Oil & Gas Inc. Market Cap to Revenue Ratio

Corporate company logo of Magnolia Oil & Gas Inc. (MGY)

Magnolia Oil & Gas (MGY) faces operational risks due to its high dependence on external drilling contractors, which is reflected in the company's market cap-to-revenue ratio, currently standing at 3.90. Amidst commodity competition for prime acreage, the business is betting on geology and a deliberate avoidance of R&D, focusing instead on standardized extraction methods to maximize profits.

magnoliaoilgas.com (MGY) - Price-to-Revenue Ratio from 07/04/2022 to 11/14/2026

Metric breakdowns and analytics for Magnolia Oil & Gas Inc. (MGY)
- current quotes and average value forecast:
General company analysis:MGY magnoliaoilgas.com
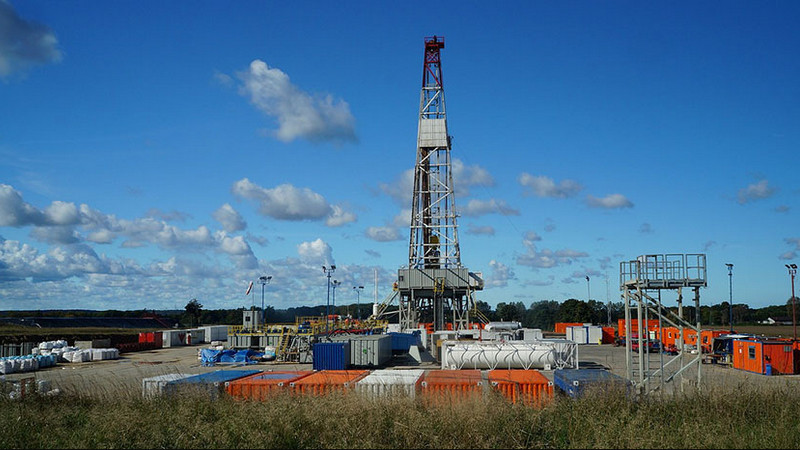
Mass-produced product of Magnolia Oil and Gas

Magnolia Oil & Gas (MGY) operates high-margin wells in Texas, ensuring a stable cash flow due to low production costs. The company's market value-to-revenue ratio, illustrated on this price-to-sales chart, demonstrates the premium the market is willing to pay for every dollar of turnover, allowing for an assessment of the asset's overbought status relative to actual sales volumes.

Who Magnolia Oil & Gas competes with

XOM - Price to Sales|Chevron - Market Cap to Revenue|SHEL: Market Cap to Revenue Ratio|TTE - Price-to-Revenue Ratio|Price-to-Sales Ratio COP|bp.com (BP) - Price-to-Revenue Ratio|CNQ (cnrl.com) - Price-to-Revenue Ratio|Price-to-Revenue Ratio EOG Resources Inc|Price to Sales Equinor Group EQNR|Price-to-Revenue Ratio Marathon Petroleum (MPC)|PSX (P66) - Market Capitalization-to-Revenue Ratio|P/S Multiple SU (Suncor Energy Inc.)|P/S Multiple eni.com E|VLO: Market Cap to Revenue|Imperial Oil Ltd. - Market Cap to Sales Volume|PBR: P/S Multiple|OXY - Price-to-Revenue Coefficient|Price-to-Revenue Ratio Diamondback Energy|Price to Sales cenovus.com CVE|Price-to-Revenue Ratio EQT Corporation (EQT)|Woodside Energy Group Ltd - Market Cap to Revenue Ratio|Price-to-Revenue Ratio Chesapeake Energy EXE|DVN - Market Cap to Revenue|Ecopetrol S.A. - P/S Multiple|CTRA - P/S Multiple|PR: P/S Multiple|Price-to-Revenue Multiple Ovintiv Inc OVV|Price-to-Revenue Ratio YPF SA|Market Cap to Revenue Ratio AR (Antero Resources Inc.)|Price-to-Revenue Ratio HF Sinclair Corporation (DINO)|APA - Price to Sales|Price-to-Revenue Ratio Range Resources Corporation RRC|National Fuel - Price-to-Revenue Ratio|Oasis Petroleum - P/S Multiple|Price-to-Revenue Coefficient Matador Resources Co. MTDR|CRK: P/S Multiple|California Resources Corporation (CRC) - P/S Multiple|Market Cap to Revenue CNX|UGP: Market Capitalization-to-Revenue Ratio|Price-to-Revenue Ratio Sasol Group (SSL)|LB - Price to Sales|P/S Multiple MUR (Murphy Oil Corporation)|Price-to-Revenue Coefficient pbfenergy.com (PBF)|VIST - Price-to-Revenue Ratio|CVI: Price-to-Revenue Ratio|SM (SM Energy Corp) - Market Cap to Revenue|Gulfport Energy Inc. - Market Capitalization-to-Revenue Ratio|Market Cap to Revenue Ratio Civitas Resources (CIVI)|EE (excelerateenergy.com) - Market Cap to Sales Volume|Market Cap to Revenue SOC (Sable Offshore)|CRGY (Crescent Energy Corp) - Market Capitalization-to-Revenue Ratio|P/S Multiple BTE (Baytex Energy Inc.)|Price-to-Revenue Multiple Delek Corp|BKV Inc. - P/S Multiple|PARR - P/S Multiple|NextDecade Corporation (NEXT) - Price-to-Revenue Ratio|TALO - Price-to-Revenue Coefficient|Price-to-Revenue Ratio Kimbell Royalty|Market Cap to Revenue Mach Natural (MNR)|P/S Multiple AESI|vermilionenergy.com (VET) - Price-to-Revenue Multiple|Diversified Energy Company PLC - Market Cap to Revenue|HighPeak Energy Inc (HPK) - Price to Sales|KOS - Price-to-Revenue Ratio|Price to Sales Vital Energy Corp|REPX: P/S Multiple|EGY - Price-to-Revenue Coefficient|Price-to-Revenue Ratio SandRidge Energy|Price-to-Revenue Ratio OBE|Market Cap to Revenue TBN (Tamboran Energy)|GFR (Greenfire Corp) - Market Capitalization-to-Revenue Ratio|P/S Multiple GPRK (GeoPark Limited)|P/S Multiple bry.com BRY|PNRG - Price-to-Revenue Ratio|WTI (W&T Offshore, Inc.) - Market Cap to Revenue Ratio|HUSA: P/S Multiple|Market Cap to Revenue Ratio REI|Market Cap to Revenue KGEI|EPM: Market Capitalization-to-Revenue Ratio|P/S Multiple AMPY|grantierra.com (GTE) - Price-to-Revenue Multiple|P/S Multiple EP (Empire Petroleum)|P/S Multiple Epsilon Energy Limited EPSN|PROP - Price-to-Revenue Ratio|Price-to-Revenue Coefficient PEDEVCO Corp. PED|NRT (North European Oil Royalty Trust) - Market Cap to Revenue|Indonesia Energy Corp - Market Capitalization-to-Revenue Ratio|USEG (U.S. Energy Corp) - P/S Multiple|Price to Sales Halcón Resources BATL|Market Cap to Revenue MXC (Mexco Energy)|eon-r.com - Market Cap to Revenue Ratio|Price-to-Revenue Ratio Barnwell Industries, Inc. BRN|MARPS (Marine Petroleum Trust, Inc.) - Price-to-Sales Ratio|TPET - Price-to-Revenue Ratio|PRB: Price-to-Revenue Ratio|STAK Energy (STAK) - Price-to-Revenue Ratio|Price to Sales Adams Resources & Energy, Inc. (AE)|Price-to-Revenue Ratio Camber Energy|CHK: Market Capitalization-to-Revenue Ratio|P/S Multiple HES|P/S Multiple Marathon Oil Company (MRO)|SilverBow Resources - Market Cap to Revenue|Market Cap to Sales Volume SWN (swn.com)|Tellurian - P/S Multiple|Price-to-Revenue Coefficient Veren Inc. VRN