USEG: U.S. Energy Corp. Price to Sales

Corporate company logo of U.S. Energy Corp. (USEG)

Is it worth investing in U.S. Energy Corp. (USEG) amid resource shortages driven by global sanctions? This historical P/S chart on GURU.Markets provides the answer, where the 7.60 mark captures this metric. The business relies on mature U.S. wells that serve as a cash cow with low operating costs. The safe localization of assets protects U.S. Energy Corp. (USEG) from expropriation, allowing the company to capitalize on high global prices.

USEG (usnrg.com) Price-to-Revenue Ratio history from 07/04/2022 to 06/08/2026

Metric breakdowns and analytics for U.S. Energy Corp. (USEG)
- share price and consensus valuation forecast:
Fundamental company analysis:U.S. Energy Corp, USEG
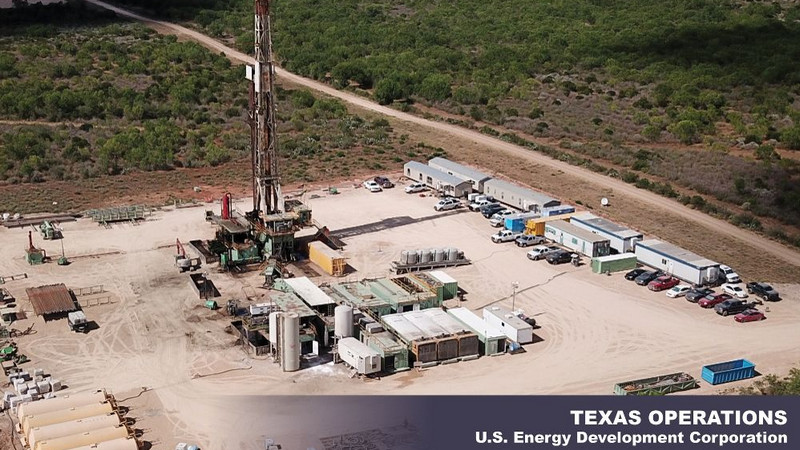
Product sample of U.S. Energy

The stable operational model of U.S. Energy Corp. (USEG) regarding mature wells is reflected in the fundamental P/S dynamics. This multiple compares the issuer's market capitalization with its total sales volume. The calculation determines the cost of one dollar of revenue that an investor is willing to pay today. For a low-cost business with predictable cash flow, an increase in this indicator signals an asset overvaluation.

Competing companies

XOM (corporate.exxonmobil.com) - Market Capitalization-to-Revenue Ratio|P/S Multiple CVX (Chevron)|Royal Dutch Shell (SHEL) - Price to Sales|TTE: Market Cap to Revenue|COP (ConocoPhillips Inc.) - Market Cap to Revenue Ratio|bp.com (BP) - Price-to-Revenue Ratio|Price-to-Sales Ratio CNQ (cnrl.com)|Price-to-Revenue Ratio EOG Resources Inc|Price-to-Revenue Ratio EQNR|Price-to-Revenue Ratio Marathon Petroleum (MPC)|PSX - Price to Sales|Price-to-Revenue Ratio Suncor Energy Inc. SU|Market Capitalization-to-Revenue Ratio E|Valero - P/S Multiple|IMO - P/S Multiple|PBR (Petrobras S.A.) - Market Cap to Revenue|OXY: Market Cap to Sales Volume|FANG (Diamondback Energy) - P/S Multiple|cenovus.com (CVE) - Price-to-Revenue Coefficient|Price-to-Revenue Ratio EQT Corporation (EQT)|WDS - Price to Sales|Price-to-Revenue Ratio Chesapeake Energy EXE|DVN: Market Cap to Revenue Ratio|EC: Market Cap to Revenue|CTRA - P/S Multiple|PR (Permian Resources Corporation) - Market Cap to Revenue|OVV - Price-to-Revenue Coefficient|Price-to-Revenue Ratio YPF SA|Antero Resources Inc. (AR) - Price-to-Revenue Coefficient|Market Cap to Revenue DINO (HF Sinclair Corporation)|Price-to-Revenue Coefficient apacorp.com|Range Resources Corporation - Market Cap to Revenue|Market Capitalization-to-Revenue Ratio NFG|Oasis Petroleum - P/S Multiple|Price to Sales Matador Resources Co.|Comstock Resources, Inc. (CRK) - Price-to-Revenue Ratio|Market Cap to Revenue Ratio CRC|MGY (Magnolia Oil & Gas Corporation) - P/S Multiple|Price to Sales CNX Resources Corp CNX|Price-to-Revenue Ratio Ultrapar Participacoes (UGP)|SSL (Sasol Corp) - Market Capitalization-to-Revenue Ratio|P/S Multiple LB (LandBridge Company LLC)|Price-to-Revenue Multiple murphyoilcorp.com|PBF: Market Cap to Revenue|Price to Sales Vista Energy Corp|CVI (CVR Refining) - Market Cap to Revenue|SM Energy Co - Market Capitalization-to-Revenue Ratio|GPOR (Gulfport Energy) - P/S Multiple|Market Cap to Revenue civitasresources.com (CIVI)|Price-to-Revenue Ratio Excelerate Energy (EE)|SOC - Price to Sales|Price-to-Revenue Ratio Crescent Energy Inc. CRGY|Market Capitalization-to-Revenue Ratio BTE|DK - Price-to-Revenue Ratio|Price-to-Sales Ratio BKV|PARR (Par Pacific) - Market Cap to Revenue|NEXT - Price-to-Revenue Coefficient|Market Cap to Revenue TALO|P/S Multiple Kimbell Corp|Price-to-Revenue Ratio Mach Natural Resources LP (MNR)|Price-to-Revenue Coefficient atlas.energy|P/S Multiple VET (Vermilion Energy)|Diversified Energy Company (DEC) - Price to Sales|HighPeak Energy Corp - P/S Multiple|Price-to-Revenue Multiple Kosmos Energy Inc. (KOS)|Vital Energy, Inc. (VTLE) - Price-to-Revenue Ratio|Price to Sales rileypermian.com (REPX)|EGY (VAALCO Energy) - P/S Multiple|SandRidge Energy Inc (SD) - Price-to-Revenue Coefficient|Price-to-Revenue Ratio Penn West Petroleum (OBE)|Price-to-Revenue Ratio TBN (Tamboran Resources Inc.)|Greenfire Resources Ltd. - Market Cap to Revenue|Market Capitalization-to-Revenue Ratio GPRK|Berry Corp - P/S Multiple|PNRG - P/S Multiple|wtoffshore.com (WTI) - Price-to-Revenue Ratio|Market Cap to Revenue Ratio HUSA|REI (Ring Energy Inc) - P/S Multiple|Market Cap to Revenue Ratio KGEI (Kolibri Global Energy Inc)|Market Cap to Revenue EPM (Evolution Petroleum)|AMPY (amplifyenergy.com) - Market Capitalization-to-Revenue Ratio|P/S Multiple GTE (Gran Tierra Energy)|Price-to-Revenue Multiple Empire Petroleum Corp|Epsilon Energy Ltd. - P/S Multiple|PROP - P/S Multiple|pedevco.com (PED) - Price-to-Revenue Ratio|NRT - Price-to-Revenue Coefficient|Market Cap to Revenue INDO|BATL: Market Capitalization-to-Revenue Ratio|P/S Multiple MXC|EONR - Price to Sales|Barnwell Industries, Inc. - Market Cap to Revenue|MARPS: Market Cap to Revenue Ratio|TPET - Price-to-Revenue Ratio|Price-to-Sales Ratio PRB|STAK Energy (STAK) - Price-to-Revenue Ratio|AE (Adams Resources & Energy, Inc.) - Price-to-Revenue Ratio|Price-to-Revenue Ratio Camber Energy|Price to Sales Chesapeake Energy Corp CHK|Price-to-Revenue Ratio Hess Corporation (HES)|MRO (Marathon Oil Company) - Market Capitalization-to-Revenue Ratio|P/S Multiple SBOW (SilverBow Resources)|P/S Multiple swn.com SWN|TELL: Market Cap to Revenue|Veren Inc. - Market Cap to Sales Volume