M/I Homes Inc (MHO): Market Cap to Revenue
Symbol and logo of brand M/I Homes Corp (MHO)

M/I Homes, Inc. relies on extensive land reserves for the systematic development of territories using standardized architectural solutions. The operating model is based on the full outsourcing of construction, allowing the company to focus exclusively on sales and design. The price-to-sales ratio reflects the demand for primary real estate, with 0.80 recorded as the baseline value.

mihomes.com (MHO): Market Cap to Revenue from 07/04/2022 to 11/13/2026

Metric breakdowns and analytics for M/I Homes Corp (MHO)
- stock price and consensus target price:
- stock exchange capitalization data:
Fundamental company analysis:MHO (mihomes.com)
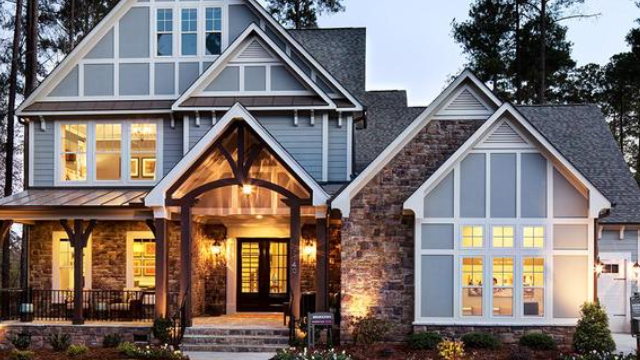
Finished products of M/I Homes

M/I Homes, Inc. (MHO) dependence on mortgage rates and US housing market cycles necessitates a business valuation relative to its actual sales. The capitalization-to-revenue ratio, illustrated on this price-to-sales chart, allows for the determination of the asset's degree of undervaluation during periods of volatility, helping investors identify a fair value range for the company relative to its generated cash flows.

Competing companies

marriott.com - Market Cap to Revenue Ratio|Price-to-Revenue Ratio D.R. Horton DHI|BEKE - Market Cap to Revenue|Toll Brothers Corp - P/S Multiple|Price-to-Revenue Coefficient FirstService Residential FSV|OPEN (Opendoor Technologies) - Market Cap to Revenue|Taylor Morrison - Market Capitalization-to-Revenue Ratio|MTH (Meritage Homes Corporation) - P/S Multiple|MRP: Market Capitalization-to-Revenue Ratio|Price-to-Revenue Ratio Kaufman & Broad (KBH)|CVCO - Price to Sales|Price-to-Revenue Ratio Champion Homes Inc SKY|GRBK - Market Cap to Revenue|Tri Pointe Homes - P/S Multiple|Price to Sales McGrath RentCorp Corp|Dream Finders Corp (DFH) - Price-to-Revenue Ratio|CCS - Price-to-Revenue Coefficient|Market Cap to Revenue PRCH|ELME: Market Capitalization-to-Revenue Ratio|P/S Multiple LGIH|Price-to-Revenue Coefficient Target Hospitality Corp|Price-to-Revenue Ratio Hovnanian Homes HOV|HOUS: Market Cap to Revenue Ratio|Beazer Homes USA, Inc. - P/S Multiple|legacyhousingcorp.com (LEGH) - Market Cap to Revenue|BETR (Better Home & Finance Holding Company) - Market Cap to Revenue|CVEO - Price-to-Revenue Coefficient|Price-to-Revenue Ratio United Homes|Market Cap to Revenue Smith Douglas Homes Inc. (SDHC)|P/S Multiple STRS|OPAD (offerpad.com) - Market Capitalization-to-Revenue Ratio|Price-to-Revenue Ratio Star Holdings Co. STHO|Skyline Builders Corp. (SKBL) - Price to Sales|InterGroup Corp - P/S Multiple|SQFT - P/S Multiple|SPHL: P/S Multiple|Market Cap to Revenue La Rosa Holdings Corp.|LSEA (Landsea Homes Corporation) - P/S Multiple|Market Cap to Revenue LuxUrban Hotels Inc (LUXH)|Price-to-Revenue Ratio New York Mortgage Trust (NYMT)