MLR - Miller Industries Corp Price-to-Revenue Ratio

Symbol and logo of brand Miller Industries Towing (MLR)

The efficiency of Miller Industries, Inc. (MLR) is tied to logistics investment cycles and steel costs. A narrow specialization in towing equipment leadership is offset by a lack of serious competitors. P/S volatility demonstrates capital inflow dynamics, while 0.70 records a new level. Its status as a global monopolist allows the company to independently determine vehicle pricing, creating stable demand.

MLR Miller Industries Price-to-Revenue Ratio (07/04/2022 - 11/14/2026)

Metric breakdowns and analytics for Miller Industries Towing (MLR)
- stock value and consensus price forecast:
Fundamental company analysis:millerind.com MLR
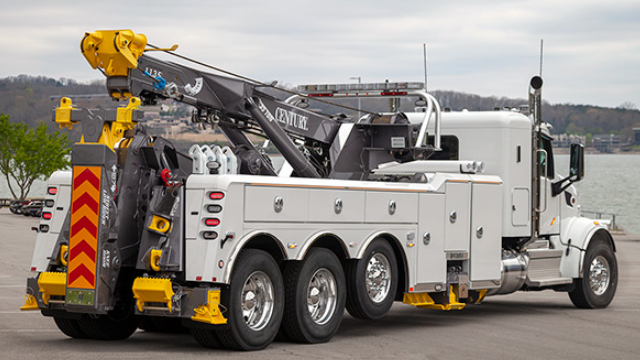
Core merchandise of Miller Industries Corp

To stress-test assets, an investor evaluates the ratio of a business's market value to its annual revenue to identify whether an asset is overbought relative to actual sales. Given the dominance of Miller Industries, Inc. (MLR) in the towing equipment niche, the P/S multiple allows for the correlation of the company's global expansion with current quotes, determining the extent of the business's fundamental overvaluation.

Competing companies

P/S Multiple caterpillar.com (CAT)|GE Vernova - Market Cap to Revenue|Lam - Price-to-Revenue Ratio|URI: Market Cap to Revenue|Price to Sales W.W. Grainger Inc|wabteccorp.com (WAB) - Price-to-Revenue Ratio|Market Cap to Revenue ritchiebros.com|GTLS (Chart Industries) - P/S Multiple|Oshkosh Corp (OSK) - Price-to-Revenue Coefficient|Price-to-Revenue Ratio Federal Signal Safety (FSS)|Price-to-Revenue Ratio GTES (Gates Corp)|Price-to-Revenue Ratio Herc Holdings Inc. HRI|terex.com - Price-to-Revenue Ratio|Hillenbrand - P/S Multiple|Price to Sales China Yuchai|Greenbrier Companies (GBX) - Price-to-Revenue Ratio|Custom Truck Corp - Market Capitalization-to-Revenue Ratio|Market Cap to Revenue GRC|ASTE: Market Capitalization-to-Revenue Ratio|P/S Multiple AEBI|Price-to-Revenue Coefficient Douglas Dynamics Inc|Price-to-Revenue Ratio Graham Corp. GHM|NWPX: Market Cap to Revenue Ratio|Manitowoc Corp - P/S Multiple|ALTG (Alta Equipment Group) - Market Cap to Revenue Ratio|GENC (gencor.com) - Market Cap to Revenue|Twin Disc Incorporated (TWIN) - P/S Multiple|Price-to-Revenue Ratio Coda Octopus Group, Inc.|Hongli Group Corporation (HLP) - Price-to-Revenue Coefficient|Market Cap to Revenue BWEN (Broadwind, Inc.)|Market Cap to Sales Volume RVSN|Price-to-Revenue Ratio Ten-League TLIH|Market Capitalization-to-Revenue Ratio CLWT|Multi Ways Holdings Ltd - P/S Multiple|Price-to-Revenue Coefficient Twin Vee Powercats Co. VEEE|VMAR: P/S Multiple|Price to Sales H&E Equipment Services, Inc. (HEES)|Price-to-Revenue Ratio Manitex|Heramba Electric PLC (PITA) - Price-to-Revenue Coefficient|Market Cap to Revenue TPIC (TPI Composites, Inc)|AEBIV (aebi‑schmidt.com) - Market Capitalization-to-Revenue Ratio