MLR (Miller Industries) Market Value to Book Value Ratio

Official company branding of millerind.com (MLR)

Miller Industries, Inc. (MLR) dominates the towing and recovery equipment segment, leveraging customer reliance on original equipment manufacturer components. The professionalism of its engineering staff guarantees uncompromising assembly quality. This price chart confirms that the indicator stands at 1.39. Absolute global market superiority and an extensive distribution network protect the company from dumping, ensuring high customer loyalty.

Miller Industries Corp (MLR) - Market Capitalization to Book Value Ratio from 07/04/2022 to 10/28/2026
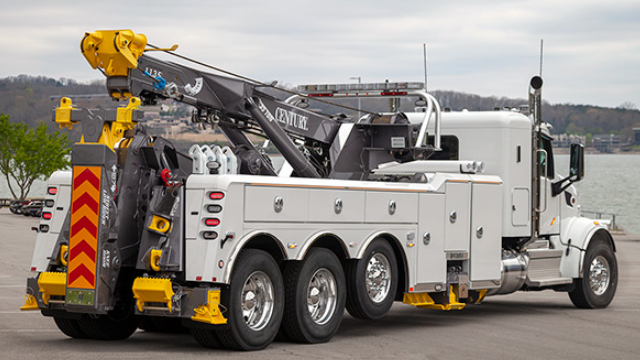
Signature product of Miller Industries Towing

This price-to-book ratio measures the premium investors are willing to pay for Miller Industries, Inc. (MLR) assets above their book value. The rising trend of this indicator reflects confidence in the company's expansion into European markets, although an excessive disconnect between the market price and equity increases the risk of a sharp correction upon any negative news.

Direct competitors

Market Capitalization to Book Value Ratio CAT|GEV (gevernova.com) - Market-to-Book Ratio|Lam Research Corporation - Market Value to Book Value Ratio|Market Value to Equity Ratio United Rentals Inc (URI)|Market Cap to Net Assets Ratio GWW|Market Capitalization to Book Value Ratio Westinghouse Air Brake Technologies Corporation (WAB)|Market Capitalization to Book Value Ratio RBA|chartindustries.com - Market Capitalization to Book Value|Market Value to Book Value Ratio Oshkosh|FSS: Market Capitalization to Net Assets|GTES (Gates) - Market Value to Book Value Ratio|Herc Corp (HRI) - Market Cap to Net Assets Ratio|Market Capitalization to Book Value Ratio TEX (Terex Corporation)|Market-to-Book Ratio HI|Market Value to Book Value Ratio China Yuchai International Limited CYD|Capitalization to Book Value Ratio The Greenbrier Companies GBX|Market Cap to Net Assets Ratio Custom Truck (CTOS)|GRC - Market Cap to Book Value Multiple|Market Cap to Net Assets Ratio Astec Industries, Inc. (ASTE)|AEBI - Market Value to Book Value|Market Capitalization to Book Value Ratio Douglas Dynamics PLOW|Graham Manufacturing (GHM) - Market Value to Book Value|Market Capitalization to Book Value Ratio NWPX (Northwest Pipe Corp)|Market-to-Book Ratio manitowoc.com|Market Capitalization to Book Value Ratio ALTG|Market Capitalization to Book Value Ratio gencor.com GENC|Market Cap to Net Assets Ratio Twin Disc TWIN|CODA - Market Value to Book Value Ratio|HLP (Hongli Group, Inc.) - Market Cap to Net Assets Ratio|BWEN: Market-to-Book Ratio|RVSN (Rail Vision Ltd.) - Market Value to Book Value Ratio|ten-league.com.sg (TLIH) - Market Cap to Net Assets Ratio|CLWT: Market Capitalization to Book Value Ratio|Market Capitalization to Book Value MWG|Market Value to Book Value Ratio Twin Vee Powercats Co. (VEEE)|Market Value to Book Value Ratio VMAR (Vision Marine Corp)|Market Value to Book Value Ratio H&E Equipment Services, Inc. HEES|Market Value to Book Value Ratio manitexinternational.com MNTX|PITA (Heramba Electric) - Market Capitalization to Book Value Ratio|TPIC: Market-to-Book Ratio|Market Value to Book Value Ratio aebi‑schmidt.com AEBIV