Marwynn (MWYN): Market Cap to Revenue Ratio

Symbol and logo of brand Marwynn Holdings, Inc. (MWYN)

The P/S ratio chart for Marwynn Holdings, Inc. (MWYN) demonstrates the impact of the holding ecosystem, where the consolidation of mass-market brands strengthens supply chains. The metric is fixed at 5.10, based on a strategy of acquiring undervalued assets to drive capitalization growth. The modernization of British warehouses, aimed at accelerating regional product distribution, provides additional support to the share price.

MWYN (Marwynn Holdings Inc.) Market Cap to Revenue history from 03/14/2025 to 11/18/2026

Metric breakdowns and analytics for Marwynn Holdings, Inc. (MWYN)
- current quotes and average value forecast:
Fundamental company analysis:Marwynn MWYN
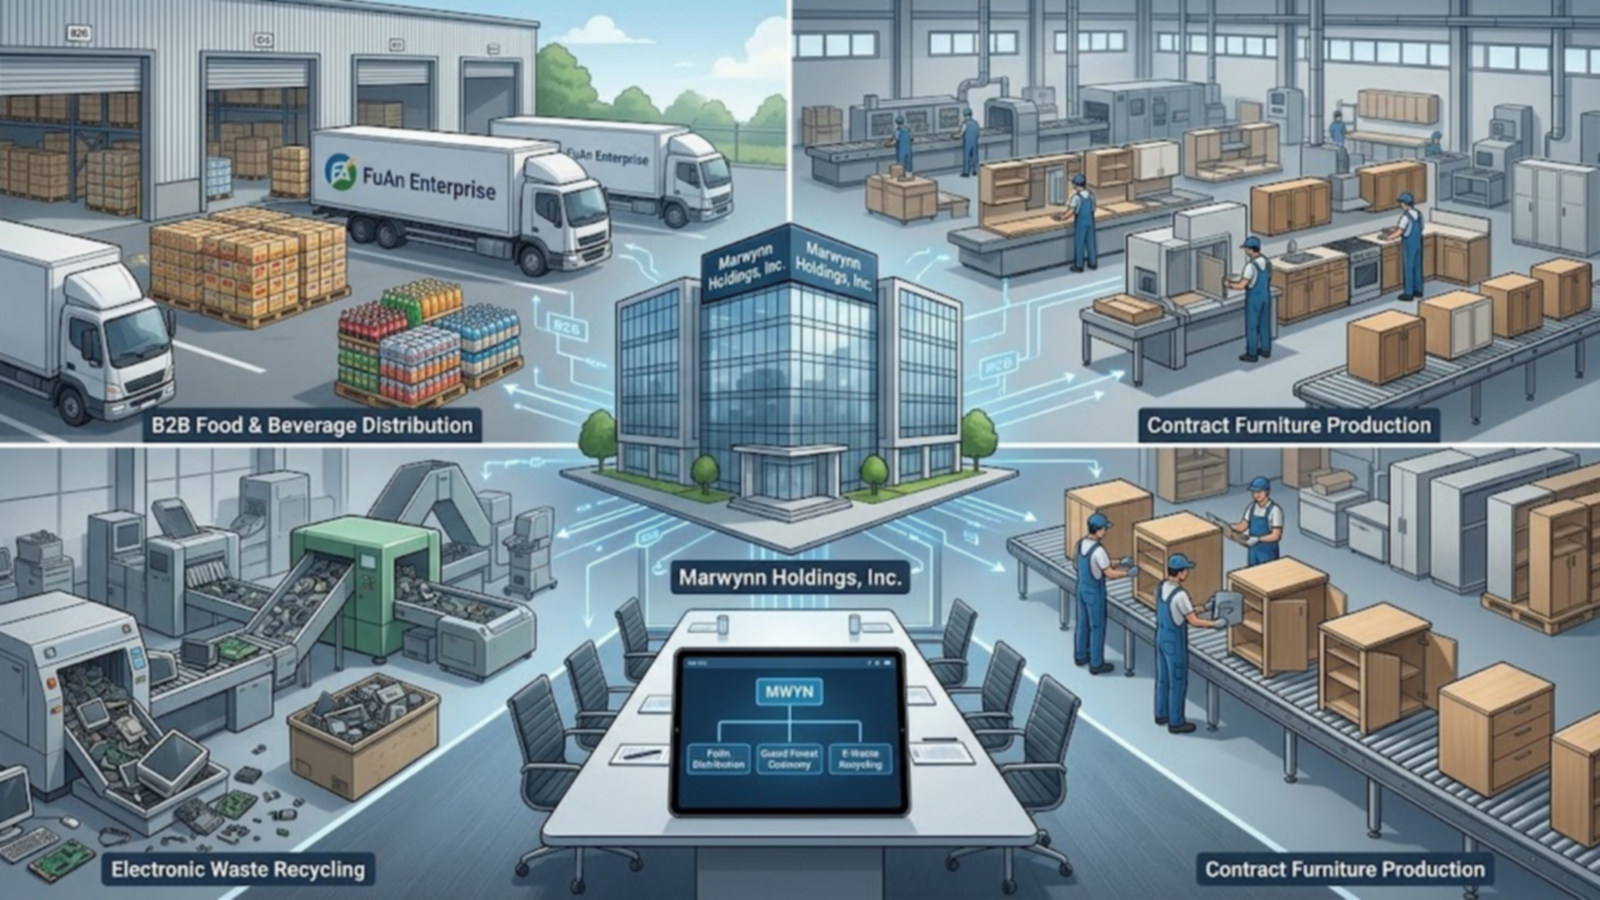
Finished products of Marwynn

The market evaluates the potential of Marwynn Holdings, Inc. (MWYN) through the lens of scaling efficiency within its logistics networks. The P/S ratio compares the company's market capitalization to its total revenue, determining the value of every dollar of sales. The current P/S valuation tracks how the expansion of UK warehouses and delivery optimization translate into growth in market capitalization. This asset is categorized as a speculative security with high sensitivity to operating revenue.

Competing companies

P/S Multiple Berkshire (BRK-A)|Price-to-Revenue Ratio Johnson & Johnson JNJ|Market Capitalization-to-Revenue Ratio GE|3M Company - P/S Multiple|Price-to-Revenue Coefficient Illinois Tool Works Inc ITW|ORIX Corporation Inc. (IX) - Price-to-Revenue Ratio|Dover Corp - Market Capitalization-to-Revenue Ratio|Price-to-Revenue Ratio Plains GP Holdings, L.P.|Market Cap to Revenue Kanzhun Ltd (BZ)|P/S Multiple LBRDA|Southwest Gas Holdings (SWX) - Price-to-Revenue Multiple|P/S Multiple CSW (CSW Industrials, Inc.)|GFF (Griffon Corp) - Price-to-Sales Ratio|Otter Tail Power - P/S Multiple|BBUC: Price-to-Revenue Ratio|PAM (Pampa Energia SA) - Market Cap to Revenue|MDU Resources Group - Market Capitalization-to-Revenue Ratio|Price-to-Revenue Ratio PotlatchDeltic|Market Cap to Revenue Ratio CSAN (Cosan)|Price-to-Revenue Ratio Newell Brands Inc. (NWL)|Price-to-Revenue Ratio BBU (Brookfield Business Partners)|Kenon Corp - Market Cap to Revenue|Price-to-Revenue Coefficient Formula Systems (FORTY)|TRS - Price-to-Revenue Ratio|Price to Sales Ziff Davis Inc|Spectrum Brands (SPB) - Price-to-Revenue Ratio|Price to Sales Tiptree Financial (TIPT)|Price-to-Revenue Ratio SOS Ltd|RHLD: Market Capitalization-to-Revenue Ratio|P/S Multiple CODI|Price-to-Revenue Ratio VHI (Valhi)|P/S Multiple TRC (Tejon Ranch Co.)|Price-to-Revenue Multiple Upexi, Inc.|BBCP - Price-to-Revenue Ratio|PureTech Health plc - Market Cap to Sales Volume|BW: P/S Multiple|NL - Price-to-Revenue Coefficient|MERC (mercerint.com) - P/S Multiple|Price to Sales Largo Inc. LGO|Price-to-Revenue Ratio Great Elm Group (GEG)|INNOVATE (VATE) - Price-to-Revenue Multiple|P/S Multiple MGLD (Marygold Companies)|Star Equity Holdings (STRR) - Price to Sales|u-g.com - P/S Multiple|Price to Sales HeartCore Enterprises, Inc.|NXPL (nextplat.com) - Market Cap to Revenue|PLAG (Planet Green Holdings Corp) - Price-to-Revenue Ratio|DSS (DSS Inc) - P/S Multiple|ARB IOT Group Ltd. (ARBB) - Price-to-Revenue Coefficient|Market Cap to Revenue GBR (New Concept Energy Inc.)|P/S Multiple Ucommune International Limited (UK)|P/S Multiple HE (Hawaiian Electric Industries, Inc.)|P/S Multiple ault.com AULT|CSW Industrials Inc. - P/S Multiple|Price to Sales Ideanomics|JCTCF: P/S Multiple|Market Cap to Revenue Ratio SPLP|VGR (Vector Group Ltd.) - P/S Multiple|P/S Multiple Gaucho Group Holdings, Inc.|P/S Multiple RHLDV