MWYN: Marwynn Holdings Company Total Revenue

Symbol and logo of brand Marwynn Holdings (MWYN)

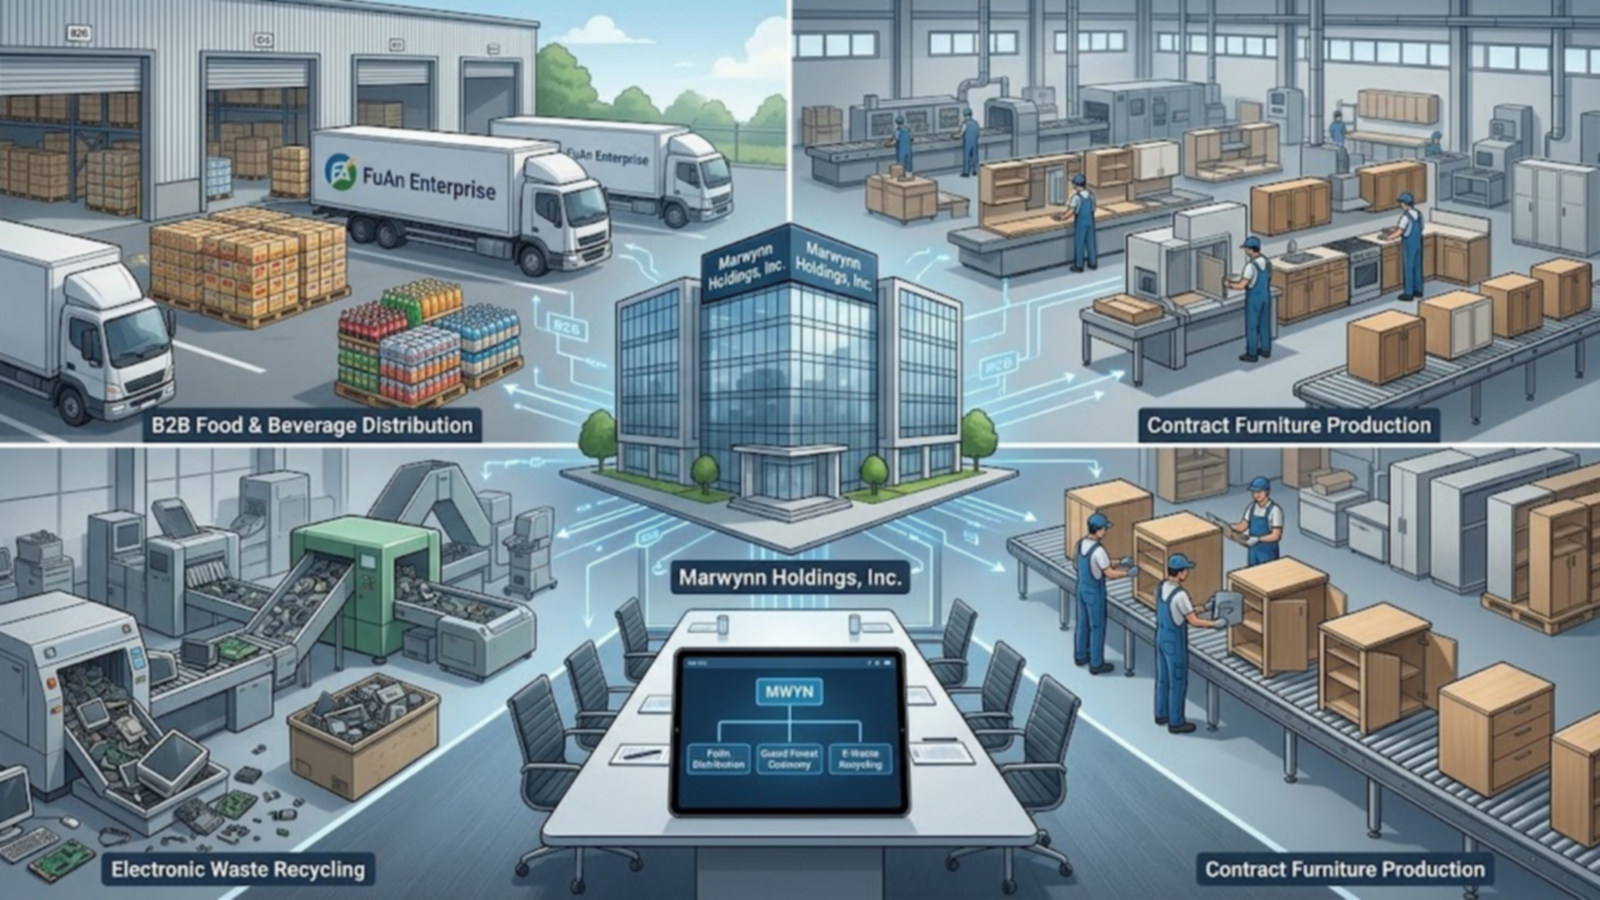
The development of Marwynn Holdings, Inc. (MWYN) depends on purchasing power and retail chain margins. The company's overall sales figures on this GURU.Markets platform chart confirm this trend, with the indicator reaching the level of 0.01. Business efficiency is increasing through the algorithmization of portfolio management. Amid stiff competition in grocery retail, the firm maintains its position through logistics optimization and customer bonuses.

Marwynn Holdings - MWYN Company Revenue (period 03/14/2025 - 11/18/2026)

Comprehensive metric breakdowns and analytics for marwynnholdings.com (MWYN)
- stock value and consensus price forecast:
- market capitalization information:
Comprehensive company analysis:MWYN (Marwynn Holdings Inc.)
Flagship merchandise of Marwynn Holdings, Inc.

This indicator aggregates actual cash inflows from product sales, reflecting the real liquidity of operating activities. This metric allows for an assessment of revenue generation efficiency relative to the market value of assets. For Marwynn Holdings, Inc. (MWYN), the growth of this volume confirms the success of a scaling strategy based on the acquisition of undervalued manufacturing and retail assets. Analyzing the company's sales chronology helps determine the balance between the holding's fundamental stability and its potential for capitalization growth.

Analysis of competing companies

BRK-A: Company Sales Revenue|Company Revenue Johnson & Johnson Co. (JNJ)|Company Revenue GE (General Electric Co.)|Minnesota Mining and Manufacturing (MMM) - Company Annual Revenue|Company Gross Revenue Illinois Tool Works Inc. (ITW)|IX - Company Revenue|Company Total Revenue dovercorporation.com|PAGP: Revenue and Sales Volume|BZ - Company Gross Revenue|Company Sales LBRDA|SWX: Company Sales Revenue|Company Revenue CSW Industrials Inc (CSW)|GFF (griffon.com) - Company Sales Revenue|Otter Tail - Company Sales|Company Sales Revenue BBUC|Pampa Energia - Revenue and Sales Volume|Company Gross Revenue MDU Resources Group MDU|PCH: Revenue and Sales Volume|cosan.com.br (CSAN) - Revenue and Sales Volume|NWL (Newell Brands Inc) - Revenue and Sales Volume|Company Total Revenue bbu.brookfield.com BBU|Company Revenue Kenon Corp (KEN)|Company Sales Formula Systems Group FORTY|Company Revenue TriMas Corp TRS|Company Sales Revenue ZD|SPB - Company Revenue|Company Sales Revenue TIPT (Tiptree Inc)|SOS: Revenue and Sales Volume|Resolute Corp - Company Sales Revenue|CODI (Compass Diversified Holdings) - Revenue and Sales Volume|VHI - Company Total Sales Volume|Company Revenue Tejon Ranch (TRC)|Upexi - Company Sales Volume|Revenue and Sales Volume BBCP (Concrete Pumping)|Company Sales Revenue PRTC|BW - Company Revenue|NL (nl-ind.com) - Company Sales Volume|Mercer (MERC) - Company Revenue|Company Total Sales Volume Largo Inc LGO|Company Revenue Great Elm Group Inc|Company Sales Volume VATE (INNOVATE Corp.)|Company Revenue Marygold Companies Inc (MGLD)|STRR (Star Equity Holdings Inc) - Company Sales Revenue|Company Revenue u-g.com UG|Company Sales Revenue HTCR|NXPL: Company Sales|Company Total Revenue Planet Green Holdings Corp.|dsssecure.com (DSS) - Company Revenue|ARB IOT Group - Company Sales Revenue|GBR (New Concept Energy Inc.) - Revenue and Sales Volume|UK - Company Total Sales Volume|Revenue and Sales Volume HE|Revenue and Sales Volume Ault Alliance, Inc. (AULT)|Revenue and Sales Volume CSWI (CSW Industrials Inc)|IDEX: Company Sales Volume|Jewett-Cameron Trading Company Ltd. - Revenue and Sales Volume|Company Gross Revenue Steel Partners Holdings LP SPLP|VGR (Vector Group Limited) - Company Sales|Company Total Sales Volume Gaucho Group Holdings Inc. VINO|Company Sales RHLDV