MYND: Mynd.ai Inc Operating Sales Margin
Mynd.ai Inc (MYND) - corporate logo

Mynd.ai, Inc. (MYND) develops software and displays for schools, competing for market share against tech giants. The operating margin level on this GURU.Markets chart illustrates profit dynamics, where -20.50 reflects the metric's baseline. The company relies on third-party clouds and contract manufacturing. Management is currently implementing AI tools, adapting the structure following the spin-off of the business into a separate IT asset.

MYND: Mynd.ai Inc Operating Margin 02/21/2024 - 11/20/2026

Mynd.ai Inc - analytical breakdowns and key metrics (MYND)
- share price and consensus valuation forecast:
- market capitalization information:
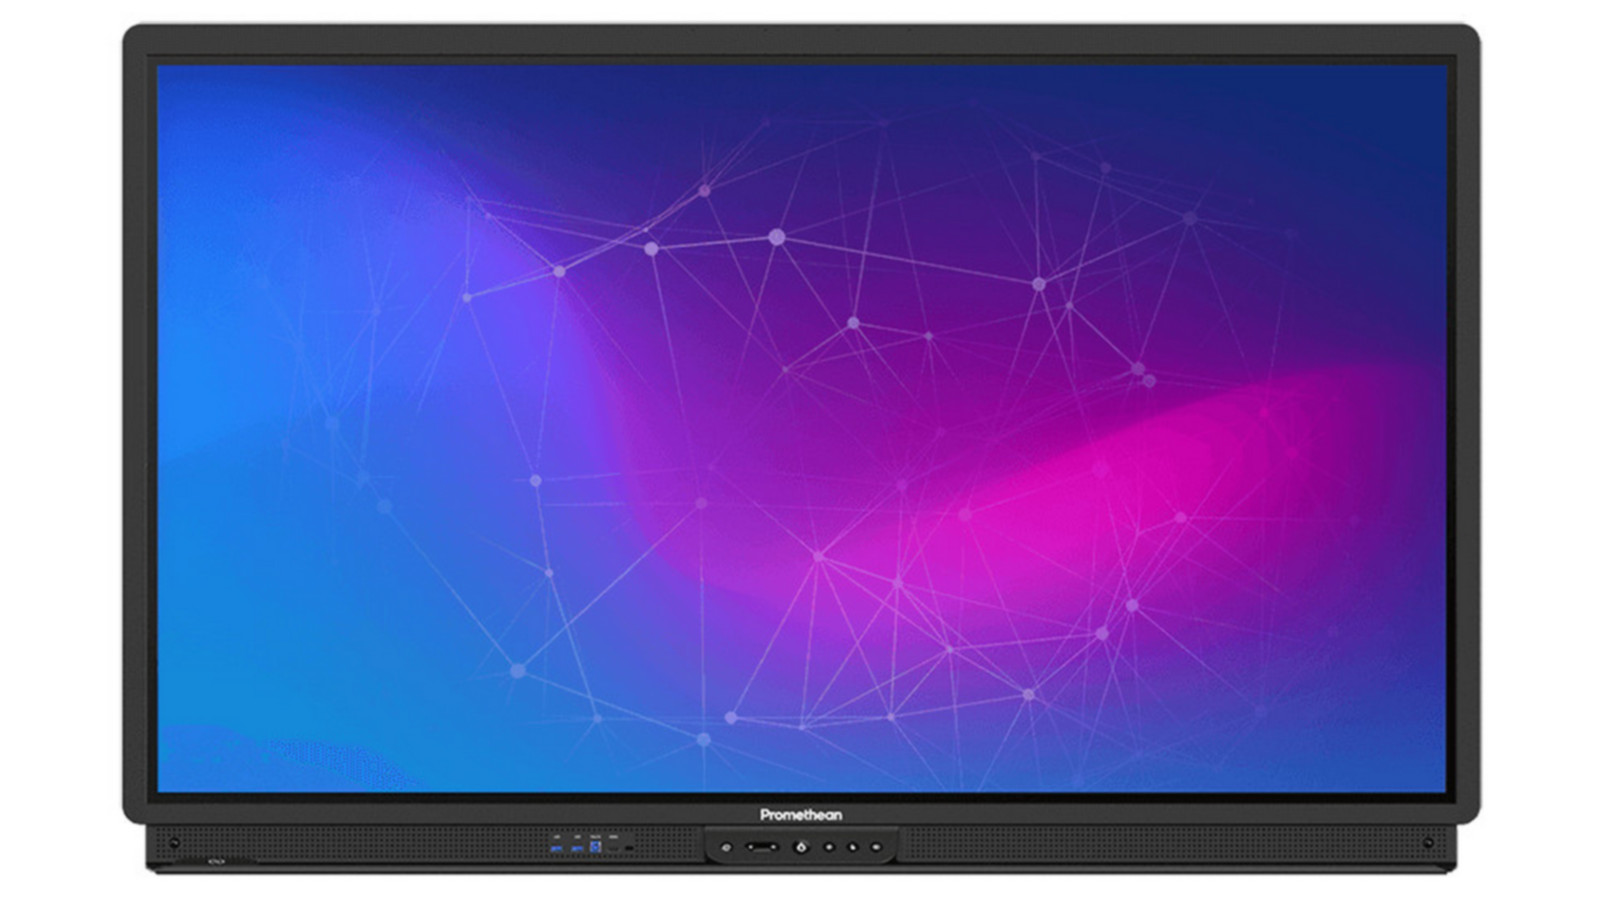
Initial company analysis:MYND, Promethean World
Brand item of Mynd.ai

For Mynd.ai, Inc. (MYND), which scales cloud AI platforms across the US and European education sectors, operating margin reflects the efficiency of converting revenue into earnings before interest and taxes. This indicator measures the share of operating income relative to sales volume, allowing investors to identify seasonal business fluctuations and assess the real cost of expanding interactive IT solutions.

Competing companies

Operating Profitability microsoft.com|GOOG: Operating Profit Rate|Operating Profitability Amazon.com (AMZN)|META (fb.com) - Operating Profit Rate|Operating Margin SPOT (Spotify Technology S.A.)|Profitability of Operations Sea Ltd (SE)|Cloudflare Inc - Operating Margin|Operating Profit Rate RDDT (Reddit Platform)|EBAY: Operating Margin|Return on Sales by Operating Profit BIDU|Operating Sales Margin VRSN|PINS (Pinterest Corp) - Operating Profit Ratio|Operating Profitability GoDaddy Inc. (GDDY)|Profitability of Operations Snap Corp|Operating Margin AKAM (Akamai Technologies)|MTCH (Match Group) - Operating Profit Margin|StubHub Center - Operating Margin|Profitability of Operations Etsy Platform ETSY|Rumble Platform (RUM) - Operating Profitability|Grindr Corp - Operating Profit Rate|Operating Sales Margin IAC|YELP (Yelp Inc.) - Operating Profit Ratio|Operating Profitability Weibo Corp (WB)|PENG - Operating Return on Sales|Operating Margin PLTK (Playtika Studios)|Operating Profit Rate VMEO|MOMO - Operating Profitability|Operating Return on Sales fiverr.com|GRPN: Operating Margin|Nextdoor - Operating Profit Rate|Operating Profitability NerdWallet.com|Operating Return on Sales NETGEAR, Inc. NTGR|Operating Margin GETY|Operating Profit Ratio ANGI|Operating Profitability Bumble Corp BMBL|Xunlei Corp (XNET) - Operating Return on Sales|Sohu Inc - Operating Margin|TSSI (TSS Corp) - Return on Sales by Operating Profit|ZH (Zhihu Corp) - Operating Sales Margin|trillercorp.com - Operating Profit Rate|Operating Profitability Baozun|ONTF (ON24 Inc.) - Operating Profit Ratio|Operating Margin DOYU|AMTD Digital Inc. - Return on Sales by Operating Profit|Operating Margin GAIA (Gaia, Inc)|Profitability of Operations vs-media.com (VSME)|GDC - Operating Profitability|soundgroupinc.com - Operating Profit Ratio|LVO: Operating Margin|Operating Return on Sales Zedge Corp (ZDGE)|Operating Sales Margin FIEE|Operating Return on Sales 36Kr.com KRKR|Operating Profitability iFeng (FENG)|XHLD (TEN Holdings Inc) - Operating Profit Rate|Operating Profitability Fangdd Network Group DUO|Operating Profit Ratio NCPL (Netcapital Inc.)|Global Interactive Tech - Operating Margin|MYSE - Operating Margin|TNMG (TNL Mediagene Inc) - Operating Sales Margin|Operating Sales Margin Cheer Holding|Operating Profitability Professional Diversity Network, Inc.|ONFO: Operating Profit Rate|Operating Margin PTRN|Operating Profit Ratio DATS|Operating Profitability Grom Social Enterprises GROM|Operating Profit Ratio HRYU (FANTOO)|LPTV - Operating Profitability|Operating Return on Sales PropertyGuru Corp|JOYY Inc. (YY) - Operating Profitability