Mynd.ai, Inc. (MYND): Market Cap to Revenue

Symbol and logo of brand rybbaby.com (MYND)

Mynd.ai, Inc. (MYND) derives its high IT potential from developments in cloud ecosystems and AI tools. The company's industry-average P/S ratio clearly demonstrates market expectations, with the indicator standing at 0.10. The business relies on the global distribution of "smart classrooms" in the US and China, yet faces severe pricing pressure and declining margins due to hardware commoditization.

MYND Promethean World Price-to-Revenue Ratio (04/01/2024 - 11/14/2026)

Promethean World (MYND) - metric breakdowns and financial figures
- stock quotes and analyst forecast:
General company analysis:MYND Promethean World
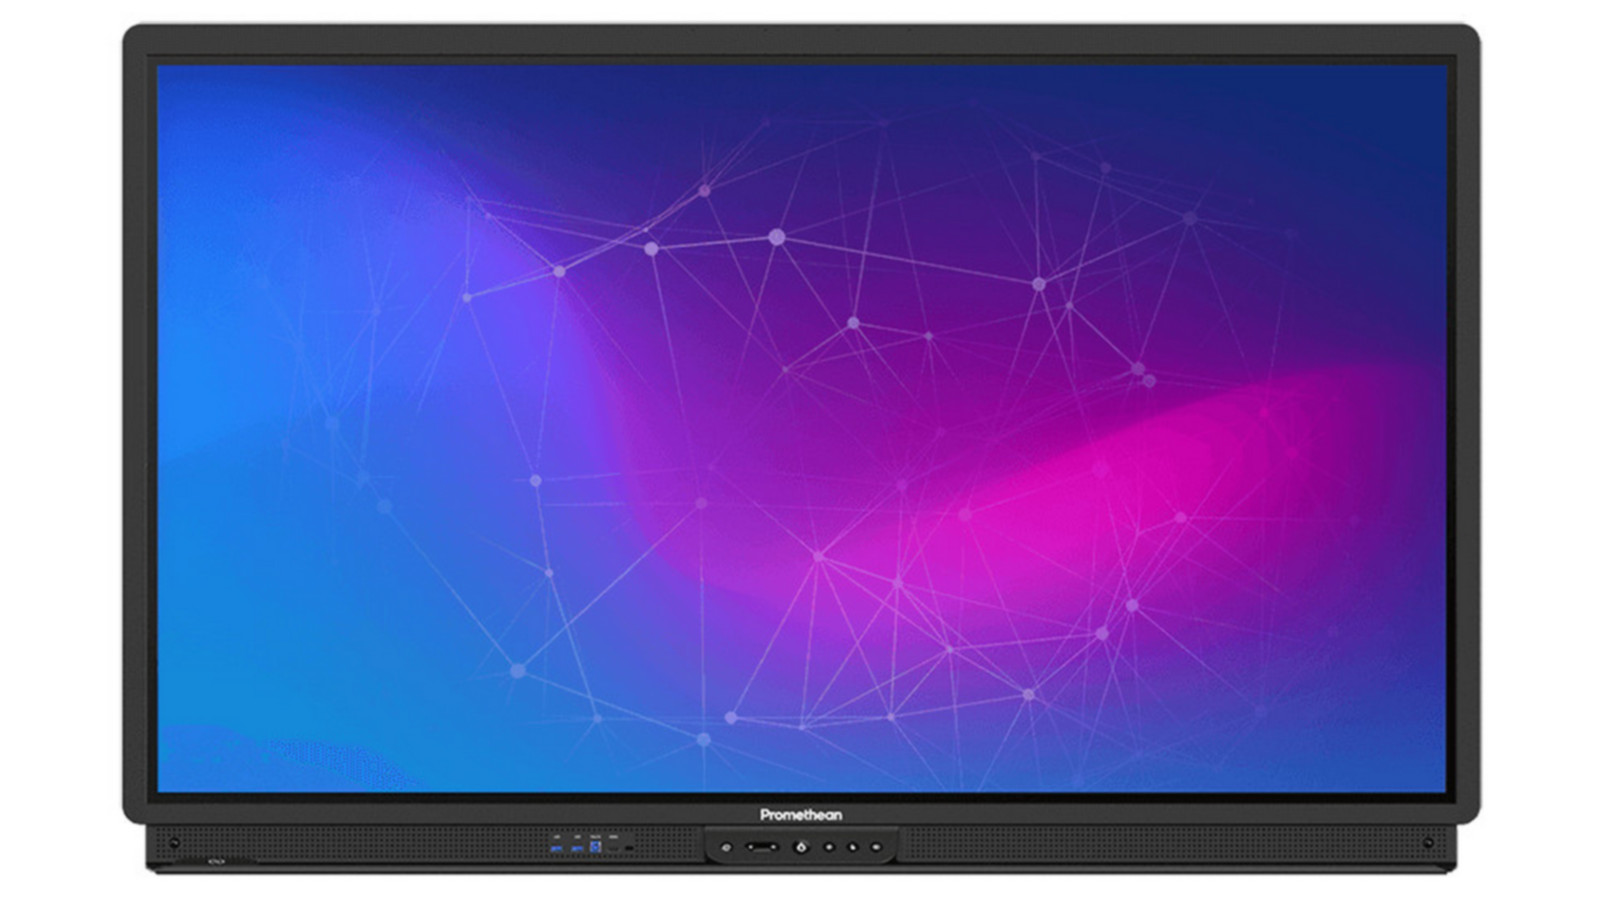
Manufactured products of Mynd.ai Inc

Assessing the resilience of Mynd.ai, Inc. (MYND) to market corrections depends on comparing market value with actual cash flows. Management's competence in integrating AI into the education sector creates a foundation for revenue growth. Analyzing the price-to-sales ratio, we see a current value of 0.10, which reflects a premium for future technologies. A low ratio signals undervaluation, whereas an inflated level increases the risk of volatility.

Competing companies

Market Cap to Sales Volume MSFT|P/S Multiple GOOG (Google)|P/S Multiple Amazon Inc. AMZN|Facebook - P/S Multiple|Price-to-Sales Ratio SPOT|Sea (SE) - Price-to-Revenue Ratio|Cloudflare (NET) - P/S Multiple|RDDT (Reddit, Inc.) - P/S Multiple|Price to Sales eBay Inc. EBAY|Market Cap to Revenue BIDU (Baidu Search)|Price-to-Revenue Coefficient VeriSign, Inc.|Price-to-Revenue Ratio Pinterest PINS|GDDY: Market Cap to Revenue Ratio|SNAP - Price-to-Revenue Ratio|Market Capitalization-to-Revenue Ratio AKAM (Akamai Technologies)|Match Group, Inc. (MTCH) - Price-to-Revenue Ratio|Stubhub Holdings Inc - Market Capitalization-to-Revenue Ratio|Market Cap to Revenue ETSY|Market Cap to Revenue Rumble Inc (RUM)|P/S Multiple GRND|Market Cap to Revenue IAC Corp IAC|P/S Multiple YELP (Yelp Inc)|P/S Multiple Weibo WB|PENG: Market Cap to Revenue|PLTK: Price-to-Revenue Ratio|VMEO: P/S Multiple|MOMO - Price-to-Revenue Coefficient|FVRR (Fiverr Corp) - P/S Multiple|GRPN: Market Capitalization-to-Revenue Ratio|Price-to-Revenue Ratio Nextdoor Holdings, Inc. (NXDR)|Price-to-Revenue Coefficient NerdWallet Inc|Price-to-Revenue Ratio Netgear NTGR|Getty Images Inc. - Price-to-Revenue Ratio|ANGI: Market Cap to Revenue|Market Capitalization-to-Revenue Ratio BMBL (Bumble Inc.)|XNET (Xunlei Limited) - Market Cap to Revenue|Price to Sales Sohu Inc (SOHU)|Market Cap to Revenue TSSI|ZH: Market Capitalization-to-Revenue Ratio|Price-to-Revenue Ratio Triller (ILLR)|Price-to-Revenue Coefficient baozun.com|Price-to-Revenue Ratio ON24 ONTF|DouYu International Holdings Limited (DOYU) - Price to Sales|amtdigital.net - P/S Multiple|Market Capitalization-to-Revenue Ratio GAIA (Gaia, Inc)|VSME: P/S Multiple|GDC - Price-to-Revenue Coefficient|Market Cap to Revenue SOGP|Market Cap to Revenue Ratio LVO (LiveOne, Inc.)|P/S Multiple ZDGE|FIEE: Price-to-Sales Ratio|P/S Multiple KRKR (36Kr.com)|Price-to-Revenue Coefficient Phoenix New Media (FENG)|XHLD - Price-to-Revenue Ratio|Price-to-Revenue Coefficient Fangdd Network Group Ltd. DUO|Netcapital Corp (NCPL) - Price-to-Revenue Ratio|Price-to-Revenue Multiple Hanryu Holdings Inc. GITS|Market Cap to Revenue MYSE|TNMG (TNL Mediagene Inc.) - Market Cap to Sales Volume|Price-to-Revenue Ratio GSMG (CHR)|P/S Multiple Professional Diversity Network, Inc. (IPDN)|Price-to-Revenue Ratio onfolio.com ONFO|PTRN: Market Cap to Revenue Ratio|datchat.com - P/S Multiple|Price-to-Revenue Coefficient Grom Social Enterprises, Inc. GROM|FANTOO (HRYU) - Price-to-Revenue Ratio|Price to Sales Loop Media Inc (LPTV)|Market Cap to Revenue PGRU|YY: Market Capitalization-to-Revenue Ratio