NTGR: NETGEAR Inc Market Price to Net Income Ratio
NETGEAR Inc - graphic logo of issuer NTGR

NETGEAR, Inc. (NTGR) generates revenue through the sale of Wi-Fi systems and routers for the residential sector. The business model relies on full assembly outsourcing in Asia, while the environmental strategy focuses on reducing plastic. The company's P/E ratio demonstrates the market valuation of the asset, where the value -16.30 expresses the state of the metric. This chart's dynamics help the investor objectively assess the business value relative to its earnings.

NTGR netgear.com: Price to Earnings Ratio in the range 07/04/2022 - 11/10/2026
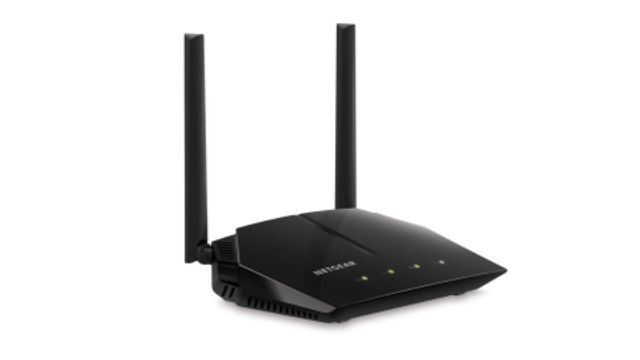
Product sample of NETGEAR

Finding a balance between operational risks and return on capital for NETGEAR, Inc. (NTGR) requires an analysis of the efficiency of a model where production is outsourced to robotic factories, while the focus has shifted toward R&D and marketing. The dynamics of the price-to-earnings ratio, reflecting the relationship between market value and annual net income, make it possible to distinguish speculative growth from fundamental business stability, where inflated values signal a risk of correction.

Analysis of competing companies

Price to Earnings Multiple MSFT (Microsoft Corp.)|Price to Earnings Ratio GOOG (Alphabet)|Market Price to Net Income Ratio AMZN|P/E Multiple META (Meta Platforms)|Spotify AB (SPOT) - Market Cap to Earnings|SE - Price to Earnings Ratio|Company Value to Net Income NET (cloudflare.com)|Reddit (RDDT) - Price to Earnings Ratio|Price to Earnings Multiple EBAY|BIDU (Baidu Corp) - P/E Multiple|Market Cap to Earnings VeriSign Corporation VRSN|Price to Earnings Ratio PINS (Pinterest, Inc.)|Market Price to Net Income Ratio GDDY|Price to Earnings Ratio Snap SNAP|AKAM: Price to Earnings Multiple|Tinder - P/E Multiple|Market Cap to Earnings StubHub Inc.|ETSY (Etsy, Inc.) - Price to Earnings Ratio|RUM: Market Price to Net Income Ratio|GRND (Grindr) - P/E Multiple|IAC - Market Cap to Net Income Ratio|P/E Multiple YELP|WB - Market Cap to Earnings|P/E Multiple PENG (Penguin Solutions Inc)|P/E Multiple playtika.com PLTK|VMEO - Price to Earnings Ratio|Company Value to Net Income MOMO (Hello Group Inc)|FVRR (Fiverr Ltd.) - Price to Earnings Ratio|Groupon.com - Company Value to Net Income|NXDR (Nextdoor Holdings Inc) - P/E Multiple|nerdwallet.com (NRDS) - Business Payback Period|Price to Earnings Ratio Getty Images (GETY)|Angi Inc - Price to Earnings Multiple|P/E Multiple BMBL (Bumble Corp)|XNET - Price to Earnings Ratio|SOHU: Price to Earnings Ratio|Business Payback Period tssiusa.com TSSI|Zhihu (ZH) - Price to Earnings Ratio|Price to Earnings Multiple ILLR|Price to Earnings Ratio BZUN|ONTF (ON24 Inc) - Market Price to Net Income Ratio|P/E Multiple DOYU|amtdigital.net (HKD) - Market Cap to Net Income Ratio|Price to Earnings Ratio Gaia GAIA|Company Value to Net Income VSME|GDC: Price to Earnings Ratio|Sound Group Inc. - Market Price to Net Income Ratio|LVO: P/E Multiple|zedge.net - Company Value to Net Income|MYND (Mynd.ai Inc) - P/E Multiple|Market Cap to Earnings FiEE Inc. FIEE|Price to Earnings Ratio KRKR (36Kr Holdings Inc)|FENG (ifeng.com) - Company Value to Net Income|P/E Multiple XHLD (TEN Holdings)|Business Payback Period Fangdd (DUO)|NCPL - Price to Earnings Ratio|GITS (Hanryu Holdings, Inc.) - Price to Earnings Multiple|MYSE (DatChat) - Price to Earnings Ratio|TNMG: Market Price to Net Income Ratio|CHR (Cheer Holding, Inc.) - P/E Multiple|Market Cap to Earnings PDN IPDN|Price to Earnings Ratio Onfolio Holdings, Inc. (ONFO)|PTRN (pattern.com) - Company Value to Net Income|Price to Earnings Ratio DatChat, Inc DATS|GROM: Price to Earnings Multiple|FANTOO - P/E Multiple|Market Cap to Earnings loop.tv|PGRU (PropertyGuru) - Price to Earnings Ratio|YY: Market Price to Net Income Ratio