PENG: Penguin Solutions, Inc. Market Price to Net Income Ratio
Penguin Solutions, Inc. - graphic logo of issuer PENG

Penguin Solutions Inc (PENG) management is adapting the business to an AI strategy, which sustains investor confidence. This P/E ratio chart demonstrates a local trend, where the current metric is 18.00. Penguin Solutions Inc (PENG) independently designs system architecture while sourcing chips externally. The implementation of liquid server cooling optimizes energy costs in accordance with ESG standards, reducing operational expenses.

PENG penguinsolutions.com: Price to Earnings Ratio in the range 07/04/2022 - 11/10/2026
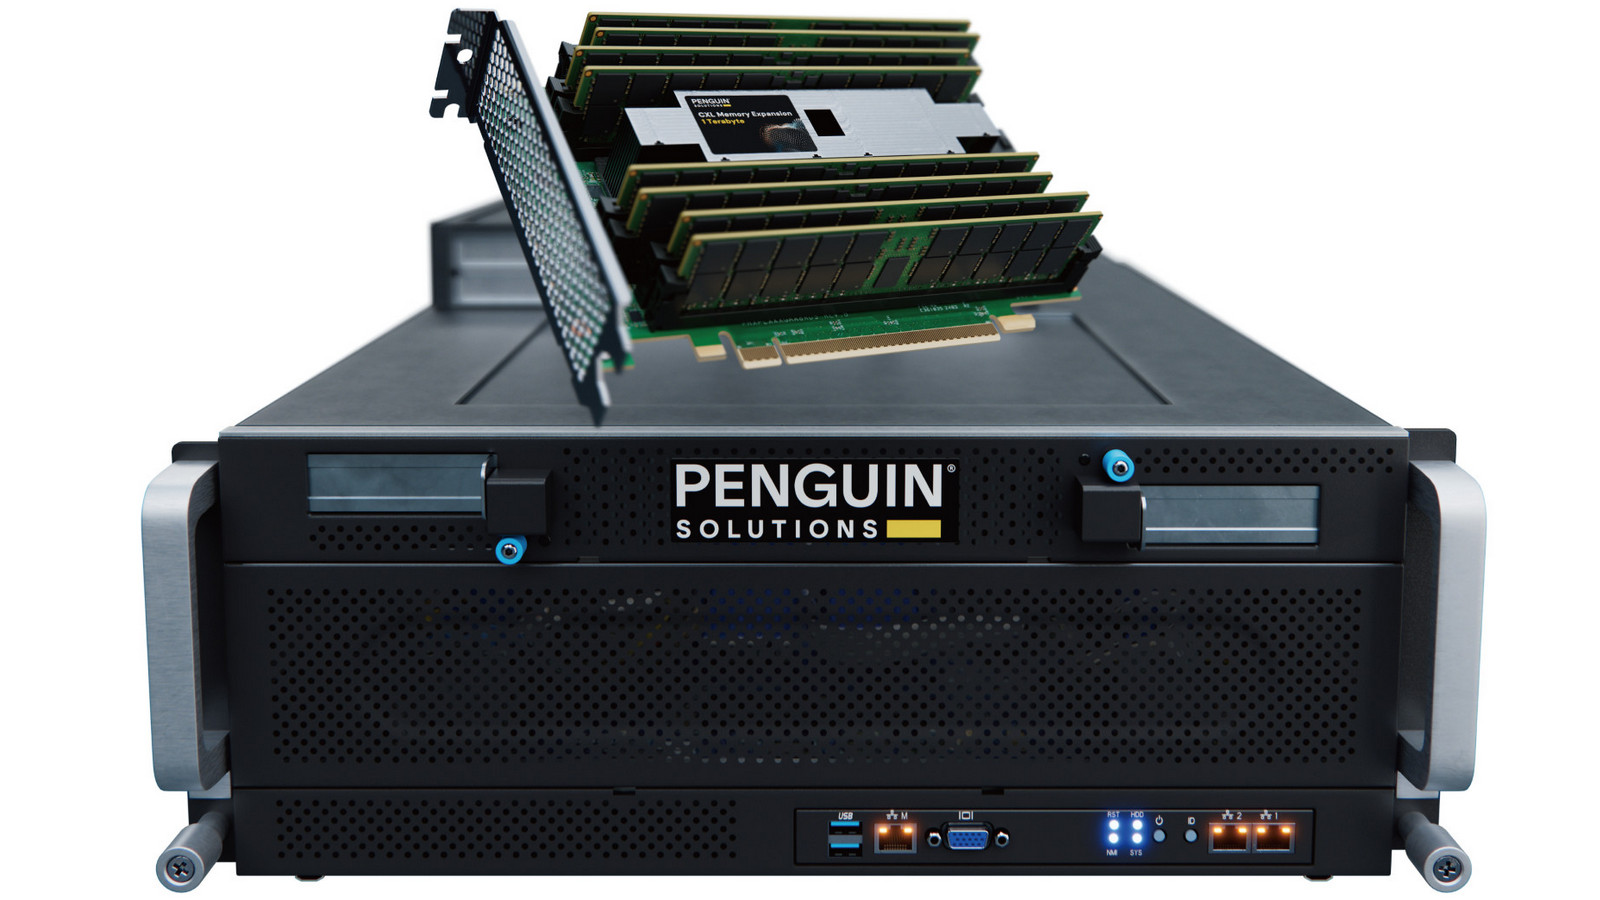
Product sample of Penguin Solutions

The P/E ratio is calculated as the ratio of market capitalization to net income, determining the cost of one dollar of earnings and the degree of overpayment for an asset. The current value of 18.00 reflects market expectations for Penguin Solutions Inc (PENG) within the AI infrastructure segment, where pressure from global competitors on margins makes the company's median P/E a key indicator of its margin of safety and business resilience to shocks.

Analysis of competing companies

Price to Earnings Multiple MSFT (Microsoft Corp.)|Price to Earnings Ratio GOOG (Alphabet)|Market Price to Net Income Ratio AMZN|P/E Multiple META (Meta Platforms)|Spotify AB (SPOT) - Market Cap to Earnings|SE - Price to Earnings Ratio|Company Value to Net Income NET (cloudflare.com)|Reddit (RDDT) - Price to Earnings Ratio|Price to Earnings Multiple EBAY|BIDU (Baidu Corp) - P/E Multiple|Market Cap to Earnings VeriSign Corporation VRSN|Price to Earnings Ratio PINS (Pinterest, Inc.)|Market Price to Net Income Ratio GDDY|Price to Earnings Ratio Snap SNAP|AKAM (Akamai Technologies, Inc.) - Market Cap to Net Income|Tinder - P/E Multiple|Market Cap to Earnings StubHub Inc.|Etsy, Inc. (ETSY) - Price to Earnings Ratio|Price to Earnings Multiple RUM|GRND (Grindr) - P/E Multiple|IAC - Market Cap to Net Income Ratio|Price to Earnings Ratio YELP (Yelp.com)|P/E Multiple Weibo Inc. (WB)|P/E Multiple PLTK (Playtika Holding Corp.)|Business Payback Period vimeo.com (VMEO)|MOMO - Price to Earnings Ratio|FVRR (Fiverr International Ltd.) - Price to Earnings Multiple|GRPN (Groupon Corp) - Price to Earnings Ratio|Nextdoor Platform - Company Value to Net Income|Price to Earnings Ratio NerdWallet, Inc.|netgear.com (NTGR) - Business Payback Period|Price to Earnings Ratio Getty Images (GETY)|ANGI - Market Cap to Earnings|Price to Earnings Ratio Bumble Corp BMBL|Xunlei Network - Price to Earnings Ratio|SOHU: Price to Earnings Ratio|TSSI - P/E Multiple|ZH (Zhihu) - Price to Earnings Ratio|ILLR: Market Price to Net Income Ratio|BZUN (Baozun Inc) - P/E Multiple|ON24 Inc (ONTF) - Business Payback Period|Price to Earnings Ratio DouYu International (DOYU)|HKD - Market Cap to Earnings|Price to Earnings Ratio Gaia GAIA|VSME: Price to Earnings Multiple|GDC - Price to Earnings Ratio|Business Payback Period Sound Group Inc. SOGP|LVO (livexlive.com) - Price to Earnings Ratio|zedge.net - Company Value to Net Income|MYND (Mynd.ai Inc) - P/E Multiple|FiEE Inc. (FIEE) - Business Payback Period|Price to Earnings Ratio 36Kr Holdings Inc (KRKR)|ifeng.com - Price to Earnings Multiple|P/E Multiple XHLD (TEN Holdings)|DUO - Price to Earnings Ratio|NCPL - Price to Earnings Ratio|Market Cap to Net Income GITS|MYSE: P/E Multiple|Market Cap to Earnings TNL Mediagene Inc. (TNMG)|Price to Earnings Ratio Cheer Holding, Inc.|Price to Earnings Multiple IPDN (PDN)|P/E Multiple ONFO|pattern.com (PTRN) - Market Cap to Net Income Ratio|DatChat, Inc - Price to Earnings Ratio|Market Price to Net Income Ratio GROM (Grom Social Enterprises Inc.)|FANTOO - P/E Multiple|Company Value to Net Income LPTV (loop.tv)|PGRU: P/E Multiple|Market Cap to Earnings JOYY (YY)