Northwest Pipe Company Inc. (NWPX): Forward Price-to-Revenue Multiple
Public company logo of Northwest Pipe Company (NWPX)

Northwest Pipe is implementing robotic welding and ultrasonic testing to eliminate pipe defects. The forward P/S valuation, with data sourced from GURU.Markets for analysis, demonstrates price dynamics, while 1.50 reflects the metric's baseline level. Demand for steel mains is rising due to the upgrading of aging networks, and the company's status as a leader in water infrastructure positions it as a beneficiary of US government spending.

NWPX (Northwest Pipe Company) Market Cap to Future Revenue Ratio history from 07/04/2022 to 11/14/2026

NWPX (Northwest Pipe Company Inc.): analytical breakdowns and indicator data
Summary company analysis:Northwest Pipe Company (NWPX)
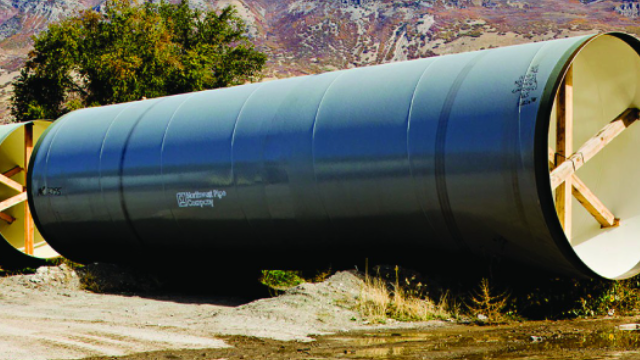
Original product of Northwest Pipe

The forward P/S ratio determines the market value of Northwest Pipe (NWPX) relative to its projected annual revenue, allowing for an assessment of the cost of each unit of expected income. Investors utilize this multiple to identify whether the asset is overbought during periods of macroeconomic volatility. Analyzing this forward price-to-sales chart helps align market expectations with the company's investments in nano-coatings and welding automation. An increase in this metric confirms market confidence in the technological modernization of pipe production.

Competing companies

Forward P/S Multiple CAT (Caterpillar)|Forward P/S Multiple GE Vernova Corp GEV|LRCX: Forward Price-to-Revenue Multiple|URI: Price-to-Projected Revenue Ratio|GWW (W.W. Grainger, Inc.) - Forward Price-to-Revenue Multiple|Market Cap to Future Revenue Ratio Wabtec (WAB)|Price-to-Projected Revenue Ratio RB Global|Market Cap to Projected Revenue GTLS (Chart Industries Inc)|Price-to-Projected Revenue Ratio Oshkosh Defense (OSK)|FSS - Market Cap to Future Revenue Ratio|Price-to-Projected Revenue Ratio Gates Industrial GTES|Forward Price to Sales HRI|TEX: Forward Price-to-Revenue Multiple|Hillenbrand Inc - Price to Expected Revenue Ratio|CYD: Forward P/S Multiple|The Greenbrier Companies Inc - Forward Price to Sales|Forward Price-to-Revenue Multiple CTOS|Forward Price-to-Revenue Multiple The Gorman-Rupp (GRC)|Forward P/S Multiple ASTE|AEBI - Market Cap to Future Revenue Ratio|Price-to-Projected Revenue Ratio Western Products PLOW|Market Cap to Expected Sales Ratio Graham Industrial (GHM)|MLR: Forward Price-to-Revenue Multiple|Manitowoc Cranes - Price to Expected Revenue Ratio|ALTG (altaequipment.com) - Forward Price-to-Revenue Multiple|Gencor Industries - Forward Price to Sales|Price-to-Projected Revenue Ratio Twin Disc, Inc.|Coda Octopus Group Inc - Future Price to Revenue|Forward P/S Multiple HLP|Market Cap to Expected Sales Ratio bwen.com|Price-to-Projected Revenue Ratio Rail Vision RVSN|TLIH (Ten-League International Holdings) - Future Price to Revenue|Euro Tech Holdings Co. Ltd. - Forward P/S Multiple|Market Cap to Future Revenue Ratio Multi Ways|twinvee.com (VEEE) - Price-to-Projected Revenue Ratio|Market Cap to Projected Revenue VMAR|Forward Price-to-Revenue Multiple HEES|Forward Price-to-Revenue Multiple Manitex International, Inc. (MNTX)|Price-to-Projected Revenue Ratio Heramba (PITA)|TPIC: Future Price to Revenue|Aebi Schmidt - Forward Price-to-Revenue Multiple