Northwest Pipe Corp (NWPX) - Market Cap to Earnings
Symbol and logo of brand Northwest Pipe Co. (NWPX)

The implementation of automated welding complexes and flaw detection control systems is modernizing the industry. The P/E valuation profile of Northwest Pipe (NWPX) on this GURU.Markets platform chart demonstrates a price vector where 16.10 characterizes this valuation parameter. A steady stream of government contracts for water pipelines ensures predictable profits, while outsourcing logistics and coating applications to external partners optimizes internal costs for Northwest Pipe.

Northwest Pipe Company Inc. - NWPX Price to Earnings Ratio (period 07/04/2022 - 11/14/2026)

Comprehensive metric breakdowns and analytics for Northwest Pipe Corp (NWPX)
- stock value and consensus price forecast:
Summary company analysis:NWPX (nwpipe.com)
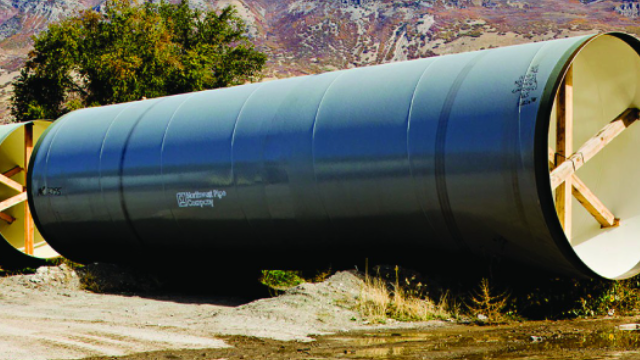
Flagship merchandise of Northwest Pipe Company Inc.

To stress-test positions, an investor must evaluate the market capitalization to net income ratio to determine the extent of the asset's overvaluation relative to its current yield. The optimization of heavy industrial logistics and ocean freight at Northwest Pipe (NWPX) directly impacts margins, which is reflected in the company's P/E chart, allowing for the differentiation of fundamental business undervaluation from the risks of declining operating revenue.

Key competitors

Price to Earnings Ratio Caterpillar Corp. (CAT)|P/E Multiple GEV|LRCX - Market Cap to Earnings|Price to Earnings Ratio United Rentals Corp URI|GWW: Price to Earnings Multiple|WAB: Price to Earnings Ratio|ritchiebros.com - Market Price to Net Income Ratio|GTLS (Chart Industries) - Price to Earnings Ratio|Oshkosh Corp - Company Value to Net Income|FSS (Federal Signal Safety) - P/E Multiple|GTES: Company Value to Net Income|P/E Multiple HRI|TEX - Market Cap to Earnings|P/E Multiple HI (Hillenbrand)|P/E Multiple China Yuchai CYD|GBX: Price to Earnings Ratio|CTOS: Price to Earnings Ratio|GRC (gormanrupp.com) - Price to Earnings Ratio|Market Cap to Earnings astecindustries.com (ASTE)|Price to Earnings Ratio Aebi Schmidt|Price to Earnings Multiple PLOW (Douglas Dynamics Inc)|Price to Earnings Ratio Graham Corp. (GHM)|MLR - Market Cap to Earnings|Price to Earnings Ratio The Manitowoc Company MTW|Company Value to Net Income ALTG|GENC: Price to Earnings Ratio|Twin Disc Incorporated - Market Price to Net Income Ratio|CODA: P/E Multiple|Hongli Group Corporation - Company Value to Net Income|Price to Earnings Ratio BWEN|Price to Earnings Ratio railvision.io (RVSN)|P/E Multiple TLIH|CLWT - Market Cap to Earnings|Price to Earnings Ratio Multi Ways Holdings Ltd MWG|Business Payback Period Twin Vee Powercats Co (VEEE)|VMAR: Price to Earnings Ratio|H&E Equipment Services - Market Price to Net Income Ratio|MNTX (Manitex) - Price to Earnings Ratio|Heramba Electric PLC - Company Value to Net Income|Price to Earnings Ratio TPI Composites, Inc|Aebi Schmidt Group - Market Cap to Net Income